Metrics
For each running Service, Koyeb collects and exposes metrics to let you easily monitor how your application is behaving. As soon as you deploy a Service on Koyeb and it turns healthy, you can access your Service’s metrics under the Metrics tab in the Service view of the control panel .
Below is a detailed explanation of all the different metrics that we expose that you can see in the Koyeb control panel:
On this page, you can also find information about our system’s data resolution and limitations.
Instance-scoped metrics
These metrics are specific to individual Instances of your Service. You can switch between the running Instances using the metric’s Instance selector.
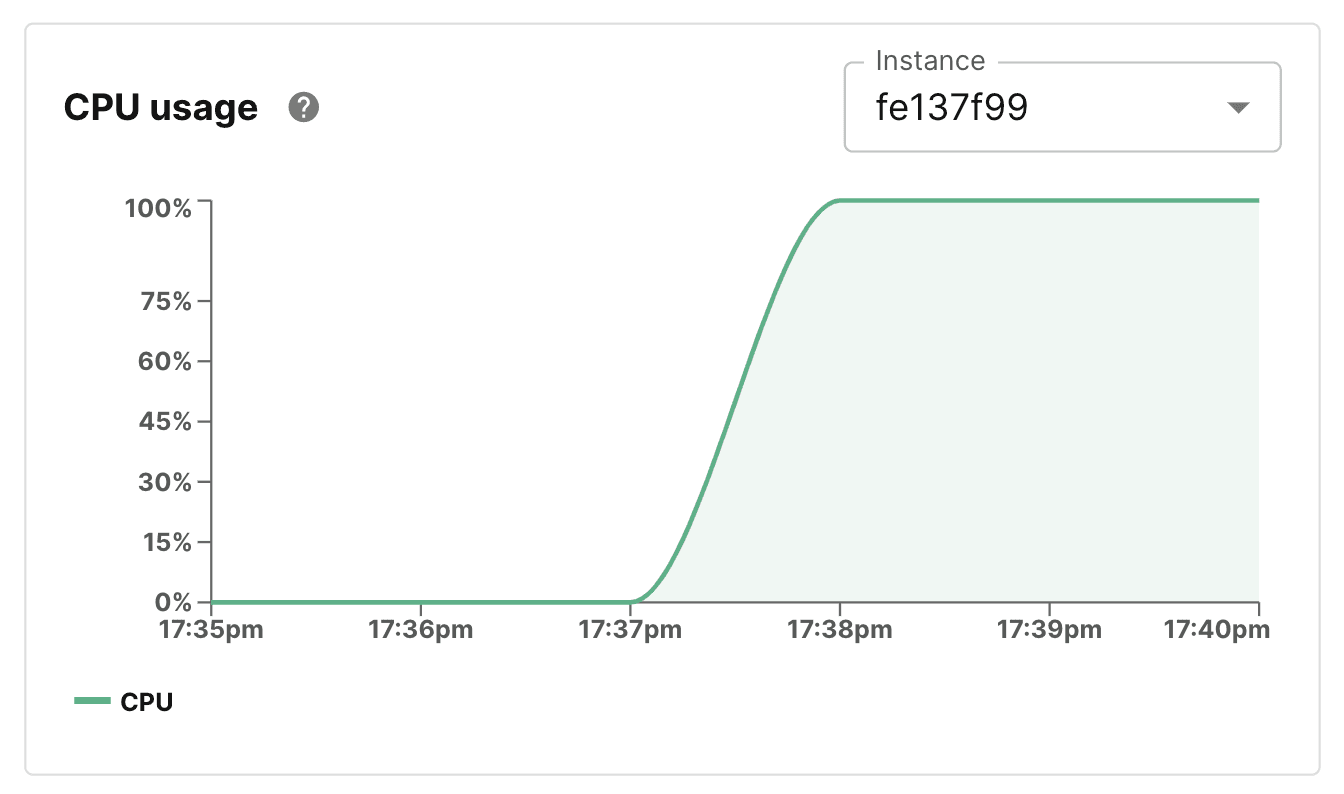
CPU usage
The percentage of CPU used by a given Instance with regards to its CPU limit. CPU usage can help you troubleshoot performance issues within your Service. A high value may cause performance issues and indicate you need to scale up your Service or switch to a bigger Instance size.
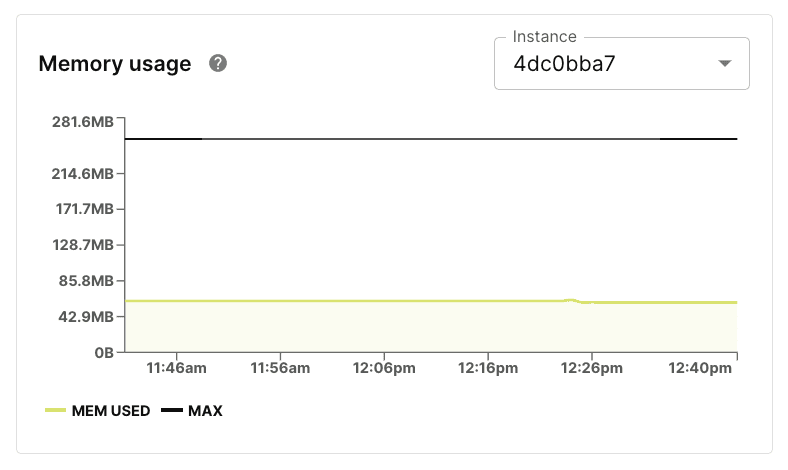
Memory usage
The amount of memory used by a given Instance. The maximum memory available for the selected Instance is also displayed. Memory usage can help you troubleshoot performance issues within your Service.
Service-level metrics
These metrics are tied to the overall Service. The values are aggregated using data from each of the Service’s Instances.
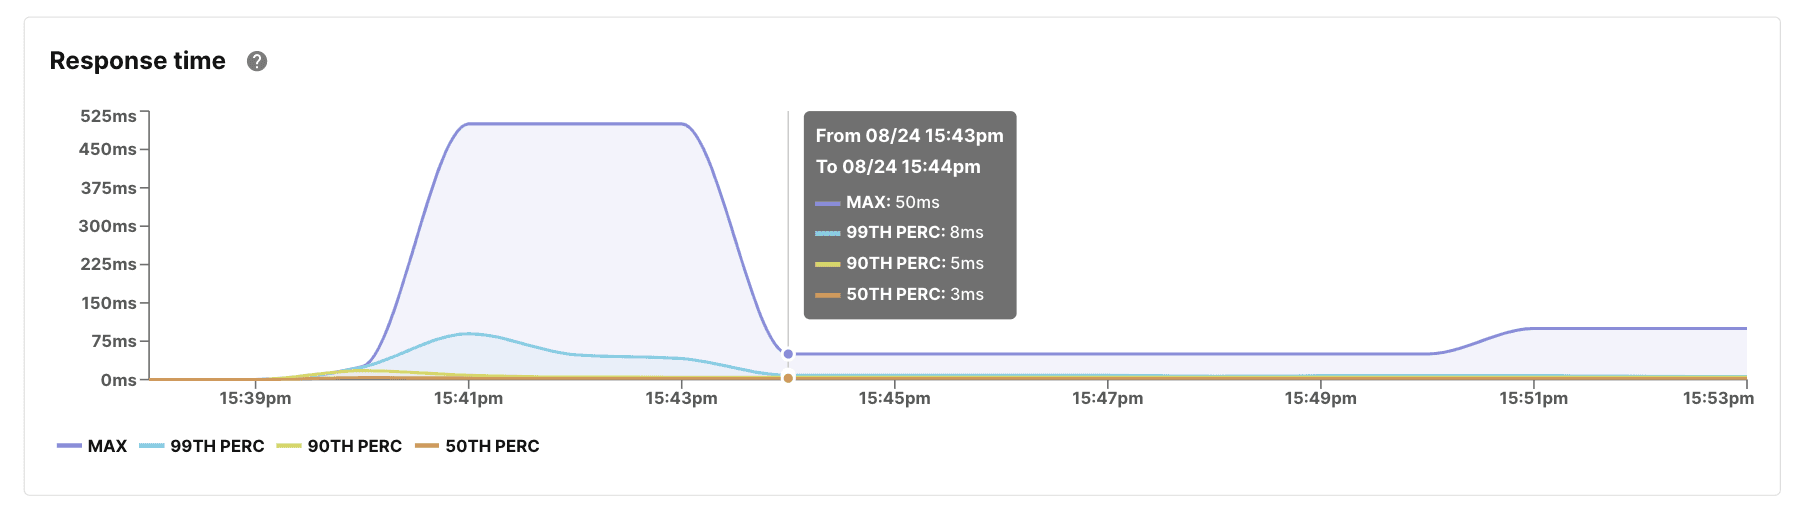
Response time
The response time, also known as latency, measures the average time it takes your Service to answer an HTTP request. The HTTP response time is an estimate based on a 5-minute average. This means you will see response time data displayed for a few minutes following requests.
The response time is displayed for different percentile values:
- 50TH PERC: Half of all requests took less than
Nmilliseconds to complete. - 90TH PERC: 90% of all requests took less than
Nmilliseconds to complete. - 99TH PERC: 99% of all requests took less than
Nmilliseconds to complete. - MAX: The longest request took
Nmilliseconds to complete.
The response time accounts for the time a request takes once it lands in a Koyeb core location. A high response time may indicate your Service is overloaded.
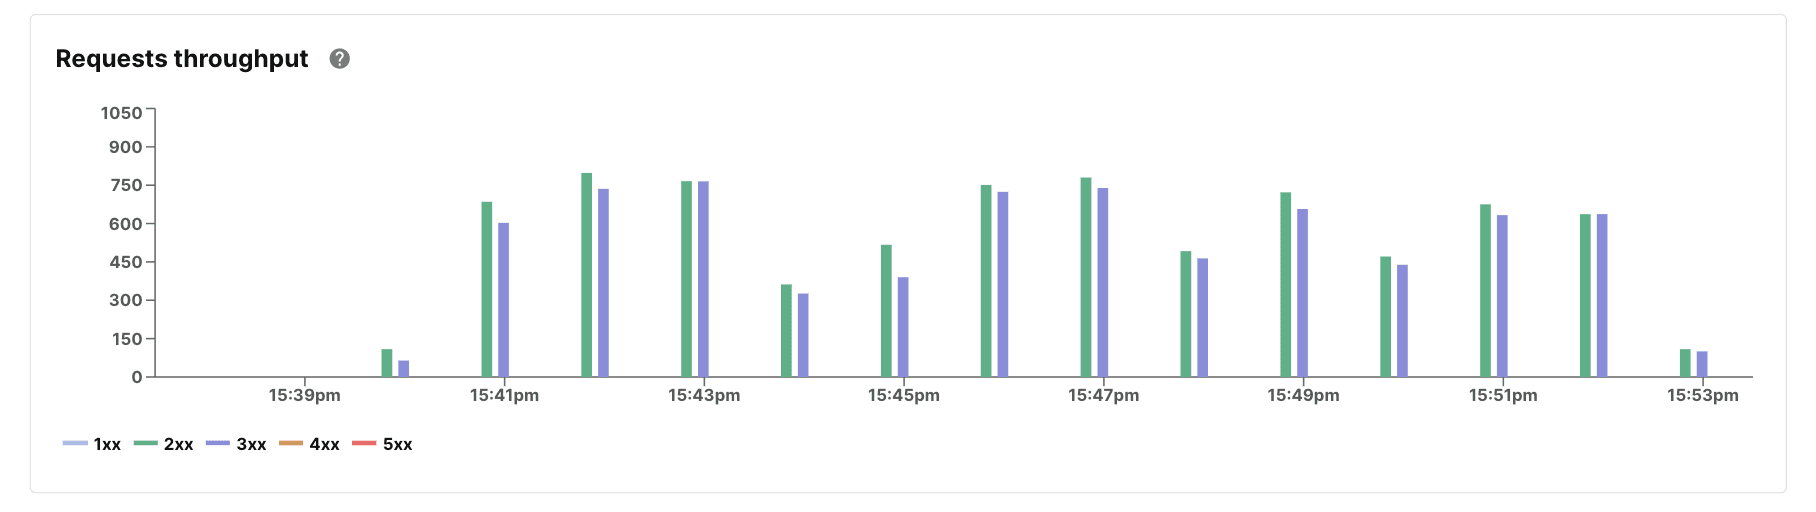
Requests throughput
The number of requests received by the Service is broken down by status code family. This gives you an overview of the error rate of your application as well as the amount of traffic it handles.
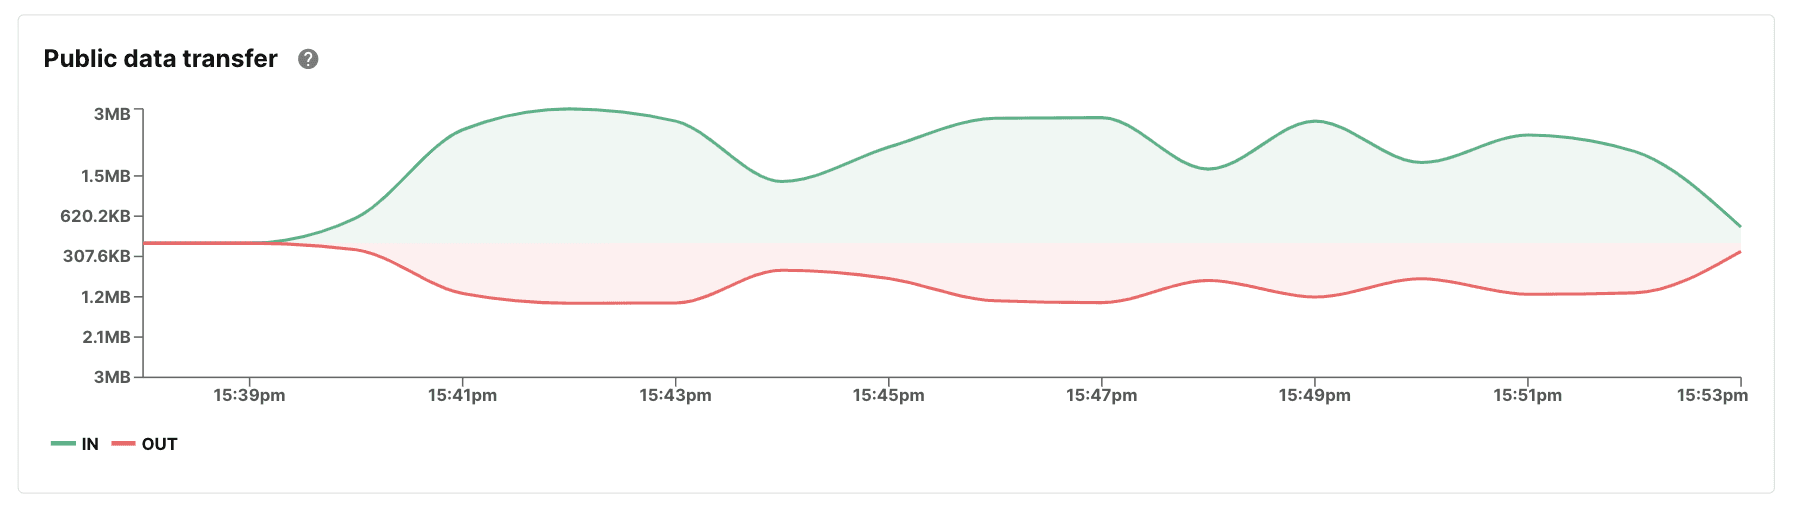
Public data transfer
The amount of outgoing and incoming bytes from the network. Looking at the public data transfer of your Service can help you monitor the network load on your Service. Note that this does not include communication between Services via the Service Mesh.
Data resolution
Metrics are collected every minute from your Services. They can be displayed for periods of 5 minutes, 15 minutes, 1 hour, 6 hours, 1 day, 2 days and 7 days with the following time increments:
- 5 minutes data resolution displays metrics for every minute in the past 5 minutes.
- 15 minutes data resolution displays metrics for every minute in the past 15 minutes.
- 1 hour data resolution displays every minute in the past hour.
- 6 hours data resolution displays metrics for every 5 minutes in the past 6 hours.
- 1 day data resolution displays metrics for every 30 minutes in the past 24 hour period.
- 2 days data resolution displays metrics for every hour from the last 2 days.
- 7 days data resolution displays metrics for every 3 hours from the last 7 days.
Limitations
Networking metrics are a reliable source of information for debugging your Services. However, there are a few limitations to keep in mind.
Why do I not see any requests for my Service?
If your Service has just started or has just started receiving requests, it’s possible that the corresponding metrics do not show up yet.
They can take up to 2 minutes to appear in the control panel.