Koyeb Metrics: Built-in Observability to Monitor Your Apps Performances
At Koyeb, we're working to build the most seamless way to deploy apps to production without worrying about infrastructure. But there's still plenty to keep you busy at the application layer with performance tuning and troubleshooting. That's why we're introducing Metrics — an easy way to monitor and troubleshoot application performance.
Deploying on Koyeb makes thinking about infrastructure or orchestration unnecessary. We built a serverless engine and a global networking layer so that you can use that time to focus on your apps. Koyeb Metrics is designed to help you understand what is happening with your services at the application level.
Monitoring the resources your applications consume and the requests they receive is key when investigating performance and stability issues. We track CPU and RAM usage as well as inbound request volume, latency, and transfers.
All your applications now benefit from built-in observability of core resources at no additional cost. Metrics are enabled by default and don't require any configuration. The feature is integrated directly into the control panel and accessible for all your services.
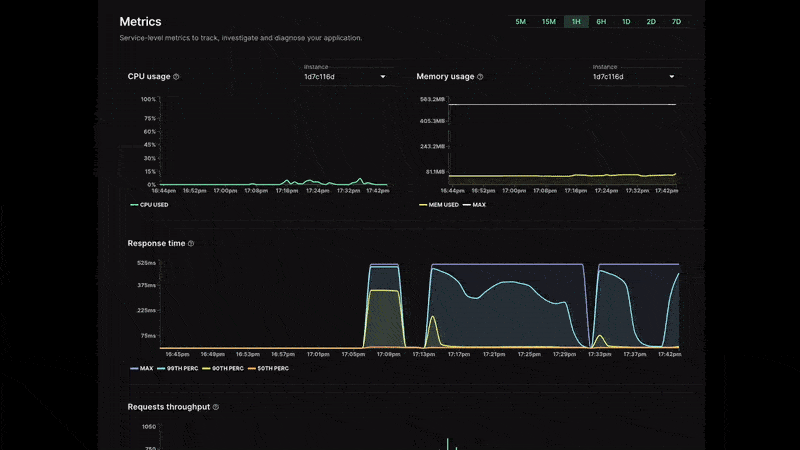
View essential metrics directly in the control panel: CPU, RAM, response time, throughput, and data transfer
When you deploy a service on Koyeb, you can view its metrics as soon as the service instances are running. Metrics are divided into two categories:
- Instance-level metrics: How much CPU and RAM each instance of your services is using.
- Service-level metrics: These metrics provide insights on the inbound requests reaching your services through our global load-balancing layer. They provide information about the overall number and error rate of HTTP requests, how much traffic they are handling, and the response time of your services.
Here are the details of the metrics we collect and expose at the instance level:
- CPU usage: This value is the percentage of CPU used by your instance. This can go over 100% if the instance you're using has more than one core.
- Memory usage: The Resident Set Size (RSS) represents the portion of memory occupied in RAM by the instance. This metric shows the amount of memory being used by your instance compared to its memory limit.
At the service level, we collect three types of metrics at our ingress gateways. These gateways are responsible for load-balancing the traffic inside of each location. We aggregate the data from all of the ingress gateways that process traffic for your service. If you're curious about what our ingress gateway is doing, we previously wrote about how we build our multi-region service mesh.
The metrics we expose at the service level are:
- Response time: This is the response time distribution by percentile of the inbound HTTP requests processed by your service.
- Request throughput: The number of requests your service receives is broken down by status code family from 100s response codes to 500s. You can easily see the overall volume and whether your service has an abnormal error rate.
- Public data transfer: The amount of incoming and outgoing traffic processed.
All of these metrics are consolidated into one dashboard, located in the Metrics tab of the service view.
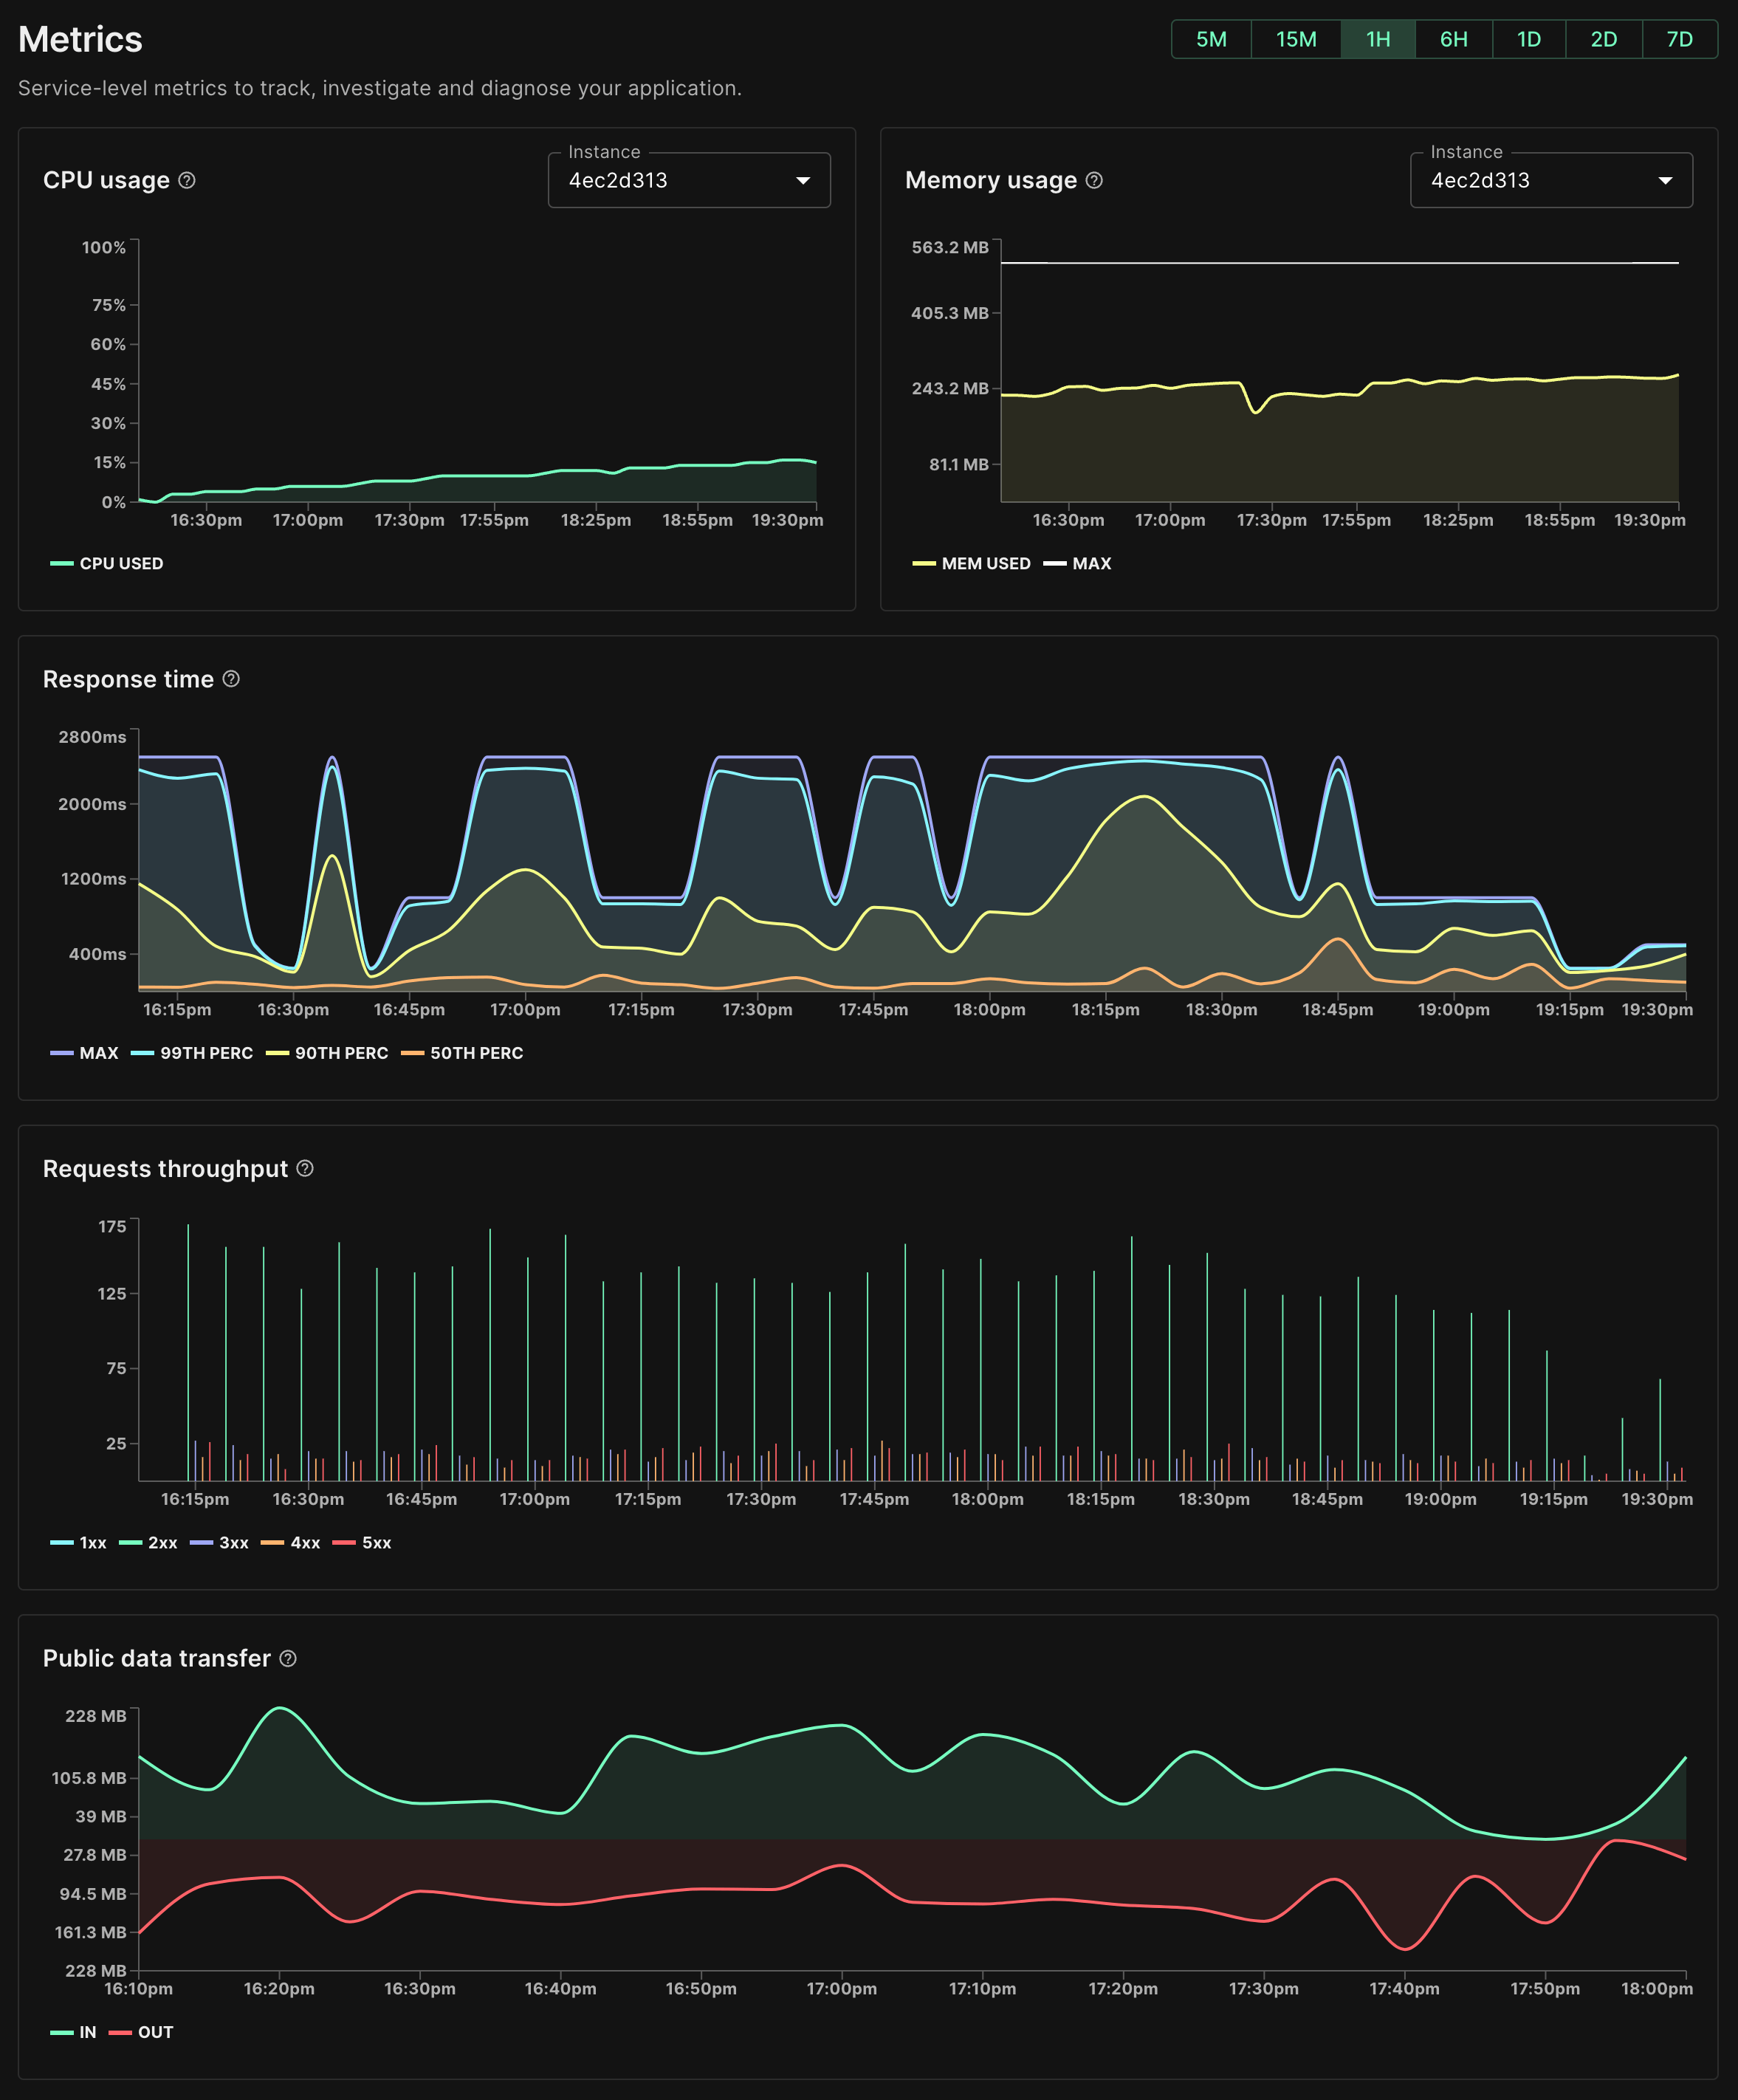
You can view data for periods of 5 minutes, 15 minutes, 1 hour, 6 hours, 1 day, 2 days, and 7 days with a granularity to the minute during the first hour.
Two important notes:
- Each time you redeploy a service on Koyeb, a new deployment is automatically created and your service is backed by new instances. As such, the CPU and memory graphs will reset after each deployment as they are scoped to a single instance (you can select it with the dropdown menu).
- The latest metrics should appear in the control panel within 2 minutes.
Monitor and troubleshoot faster
Having a high-level understanding of what is happening in your services is critical, especially when you need to investigate and diagnose performance issues. Metrics are designed to answer common questions you might face:
- How fast is the service processing request? Check the response time graph.
- I'm encountering 500-level errors. Is this a recurring issue? Check the requests throughput graph to see how common they are.
- My application keeps crashing. What is happening? If you don't see any errors in your runtime logs, your service might lack memory. Check the memory graphs of your instances and scale up your service if needed!
- Requests are slow. What is happening? Your service might be CPU bound. Check the CPU usage graph to see if your service is using all of the CPU. If so, it might perform better if you scaled your service horizontally or switched to a larger instance.
- How many requests is my service processing? You can check the HTTP throughput graph to see the traffic your service is handling.
These insights help you understand your application better and find the root cause of problems faster. You might want a more advanced observability stack for mission-critical applications, but this visibility on essential metrics should help you troubleshoot common problems.
Metrics and what's next
Metrics is a built-in feature of the Koyeb platform and is now available to all users. Behind the scenes, this feature is powered by Grafana Mimir. We have a blog post coming soon diving into the internals and explaining why we selected Mimir.
We already have some improvements in mind including additional metrics (disk usage or internal data transfer) and a prometheus compatible endpoint to scrape all your metrics. If you would like to see these features, vote for them on our feedback platform.
If this is your first time hearing about Koyeb, welcome to the fastest way to deploy applications globally! Koyeb is a developer-friendly serverless platform. No more DevOps, servers or infrastructure management. We take care of that for you, so you can focus on developing what is important to you.
- Want to get started deploying applications in minutes? Sign up today and start deploying. 🚀 🧑🚀
- Want to stay in the loop or reach out? Join our serverless community and follow us on Twitter. 💙
- Looking to read more? Check out the Metrics documentation for more information about this feature. We also frequently publish technical guides and articles, so feel free to browse our blog or check out one of our guides. 📖 🐛
- Have a feature idea you would love to see on the platform? Submit and vote for feature requests and track their progress on our public roadmap.