Deploy Grafana on Koyeb and Build a Dashboard to Visualize GitHub Data
Introduction
Grafana is a data monitoring and observability platform that allows you to collect and understand data from tools used throughout your organization. Grafana makes it easy to query data from many different sources, build graphs and dashboards to track changes in metrics, import and analyze logs, and send alerts when customizable thresholds are passed. With a large ecosystem of plugins and complementary systems, Grafana can be extended to work with whatever data is most important to you.
In this guide, we will go over how to set up a Grafana instance on Koyeb to monitor infrastructure health and essential production resources. We will deploy Grafana using the project's official Docker image, backed by a PostgreSQL database.
You can deploy and preview Grafana as configured in this guide using the Deploy to Koyeb button below:

Note: Remember to replace the value of the GF_DATABASE_URL environment variables with the connection URL for your own database.
Requirements
To follow along with this guide, you will need to create accounts with the following services. You can use each service's entry-level plan to get started:
- Koyeb: We will use Koyeb to deploy, run, and scale the Ghost process.
- Aiven: We will use Aiven to provision a PostgreSQL database to store and manage Grafana's configuration information.
- GitHub: We will use a GitHub account as a data source to demonstrate querying and visualizations in Grafana.
Steps
This guide will cover how to deploy a Grafana instance to Koyeb through the following steps:
Create a PostgreSQL database with Aiven
Before we deploy Grafana, we need to provision a database where it can store its data.
Grafana can use a number of different types of relational databases, including an embedded SQLite database by default. In this guide, we will use an external PostgreSQL database to decouple our data from the running service instance, allowing it to scale and redeploy without problems. We will use Aiven as our PostgreSQL provider since they have a free tier that is more than enough for our purposes.
To create a new PostgreSQL database, log into your Aiven account. In the Aiven console, follow these steps to create a new PostgreSQL database:
- Click the Create service button.
- On the next screen, select PostgreSQL.
- Select Free plan to get started.
- Select the region to deploy your database. In this guide, we will select
aws-eu-west-3to demonstrate deploying resources in Europe, but you should choose the region closest to your users. - Ensure that the
Free-1-5gbplan is selected. - Choose a name for your PostgreSQL database. We will use
grafana-postgresqlfor this guide. - Click the Create free service button to begin provisioning your new database.
The following screen will show the connection details for your new database. Click on the copy icon associated with the Service URI to copy the connection string and save it to a safe place for later reference. We will use this value when we configure Grafana so that it can connect to and authenticate with the database.
Deploy Grafana to Koyeb
Now that you have the database connection string, you have everything you need to configure and deploy Grafana to Koyeb.
Begin by logging into your Koyeb account. Follow these steps to deploy the default Grafana container image to the platform:
- On the Overview tab of the Koyeb console, click Create Web Service.
- Select Docker as your deployment method.
- Set the Docker image to
docker.io/grafana/grafana. Optionally append an image tag if you'd like to choose a specific image variant. - In the Environment variables and files section, click Add variable to create the following variables:
GF_SERVER_HTTP_PORT: Set to 8000. This is the variable Grafana uses to specify the port to listen on.GF_DATABASE_TYPE: Set topostgres.GF_DATABASE_URL: Set to the connection URI you copied from Aiven.GF_DATABASE_SSL_MODE: Set torequireto force Grafana to connect to the database with encryption.GF_INSTALL_PLUGINS: Set tografana-github-datasourceto install the GitHub data source.
- Choose a name for your App and Service and click Deploy.
Koyeb will pull the Grafana container image from Docker Hub and use it to provision a new container. The Grafana process will start up, connect to and initialize the database, and begin listening on the port specified in the configuration.
Start using Grafana
Once Grafana is up and running, you can visit your Koyeb Service's subdomain (you can find this on your Service's page) to connect. It will have the following format:
https://<YOUR_APP_NAME>-<KOYEB_ORG_NAME>.koyeb.app
Setting up the admin account
You will be redirected to the Grafana login page:
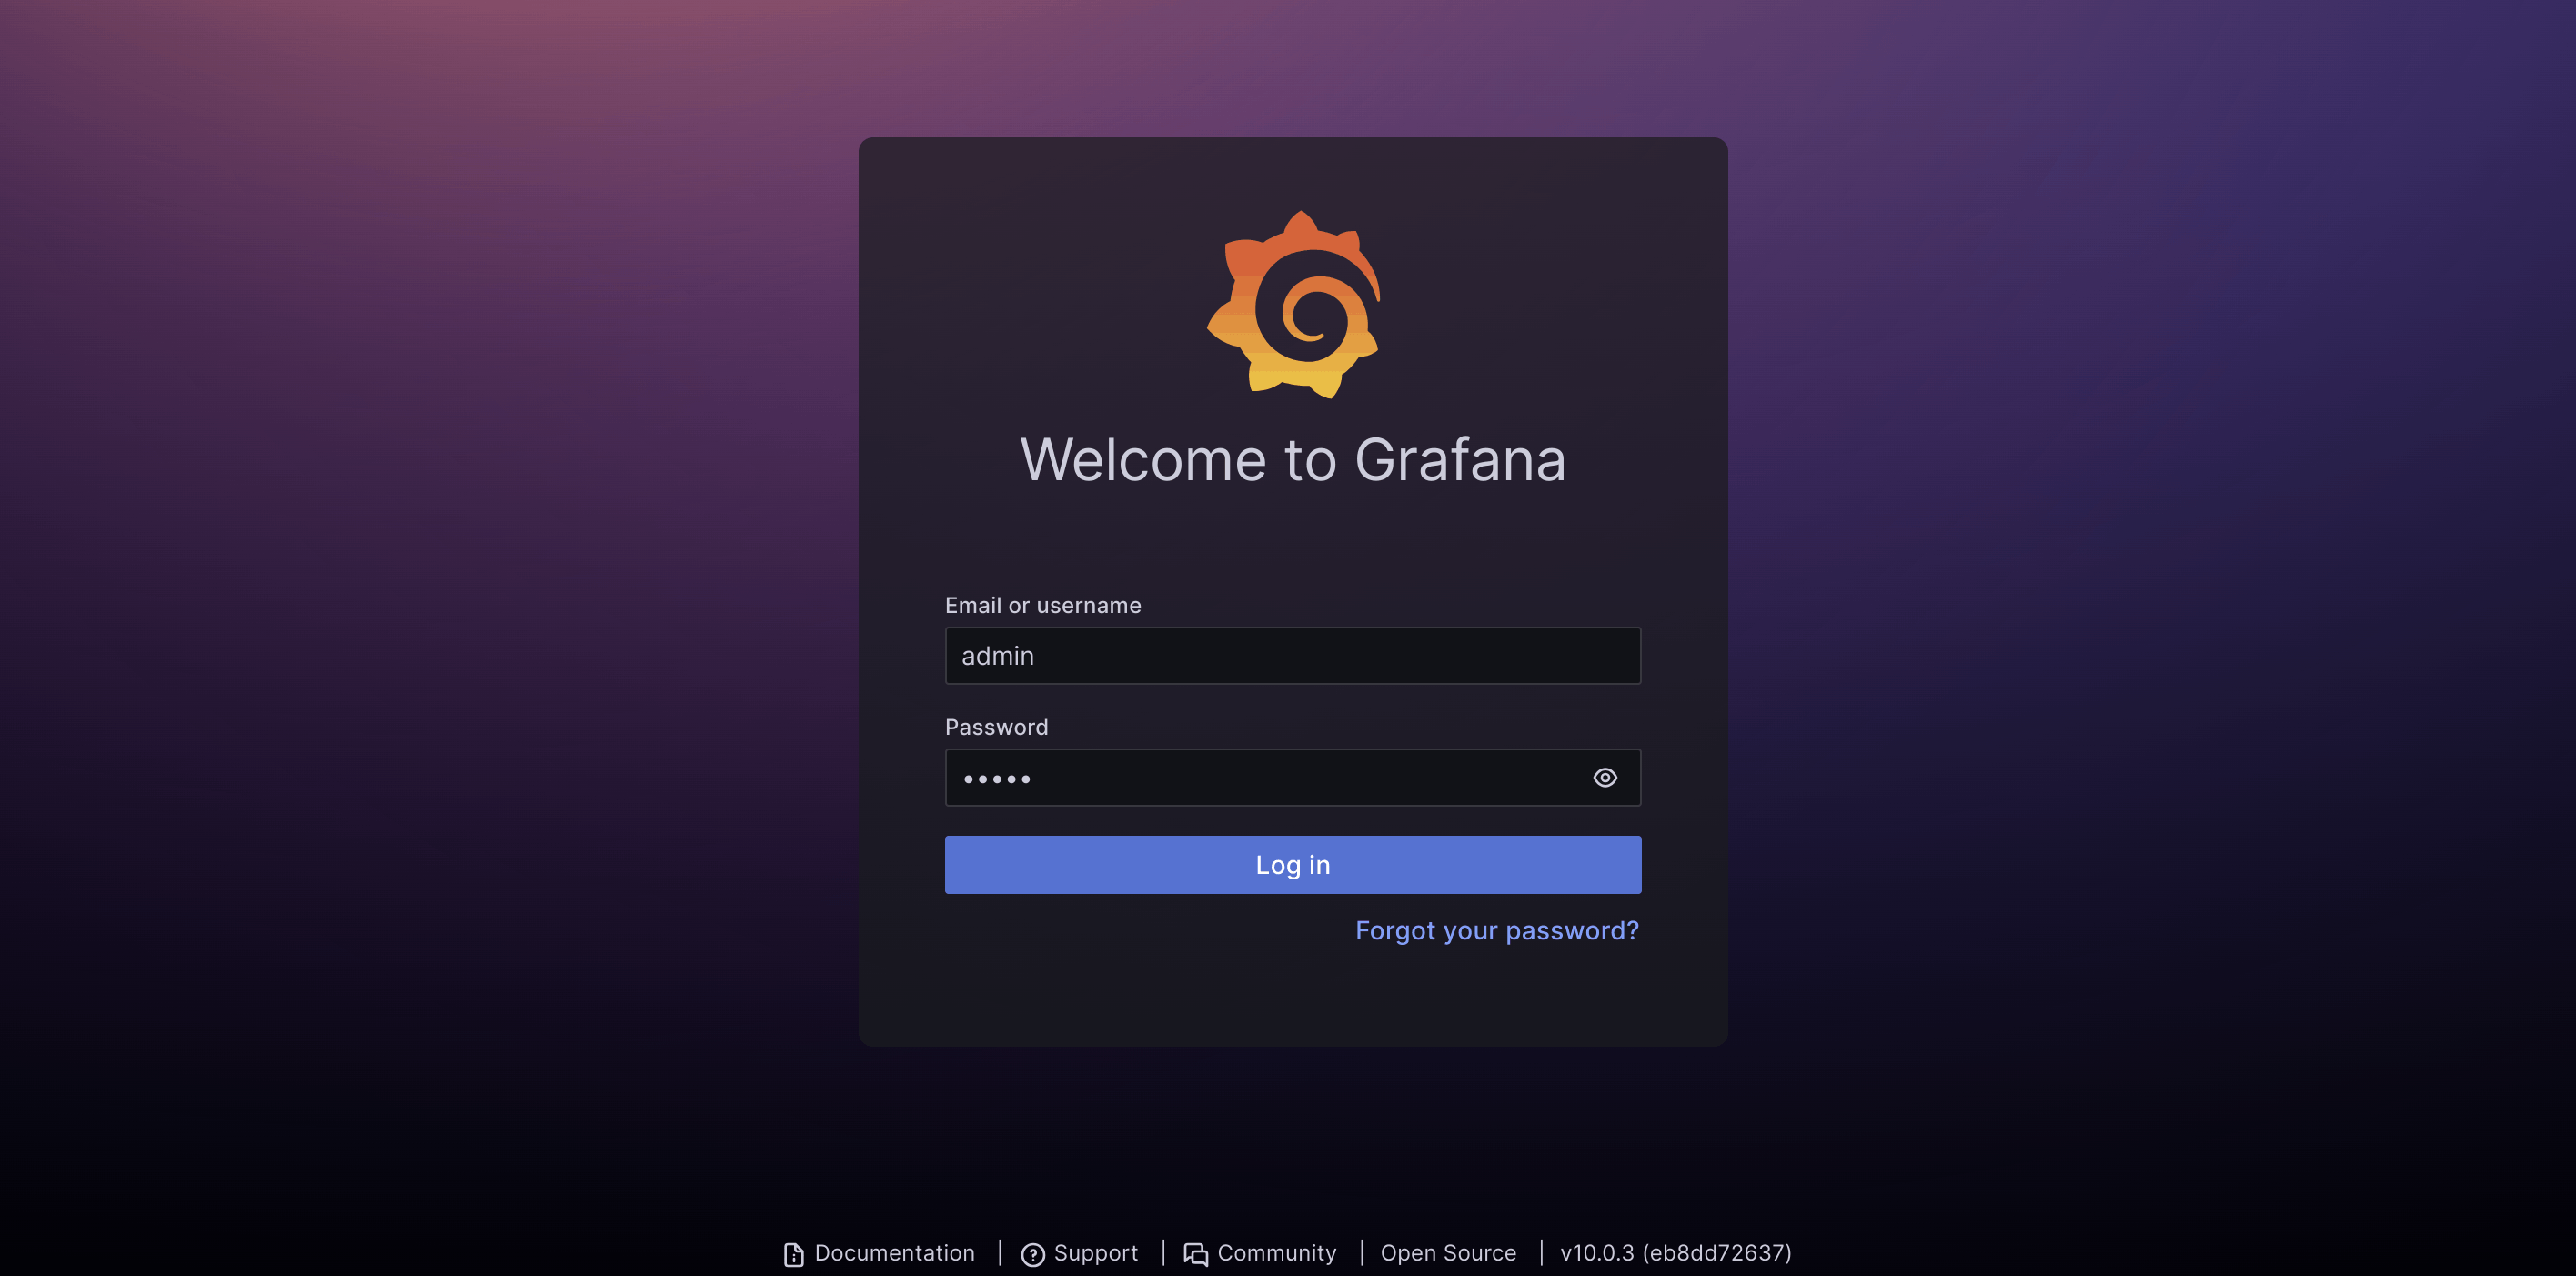
Enter admin for both the username and password to continue.
Next, you'll be asked to choose and confirm a new password for the admin account:
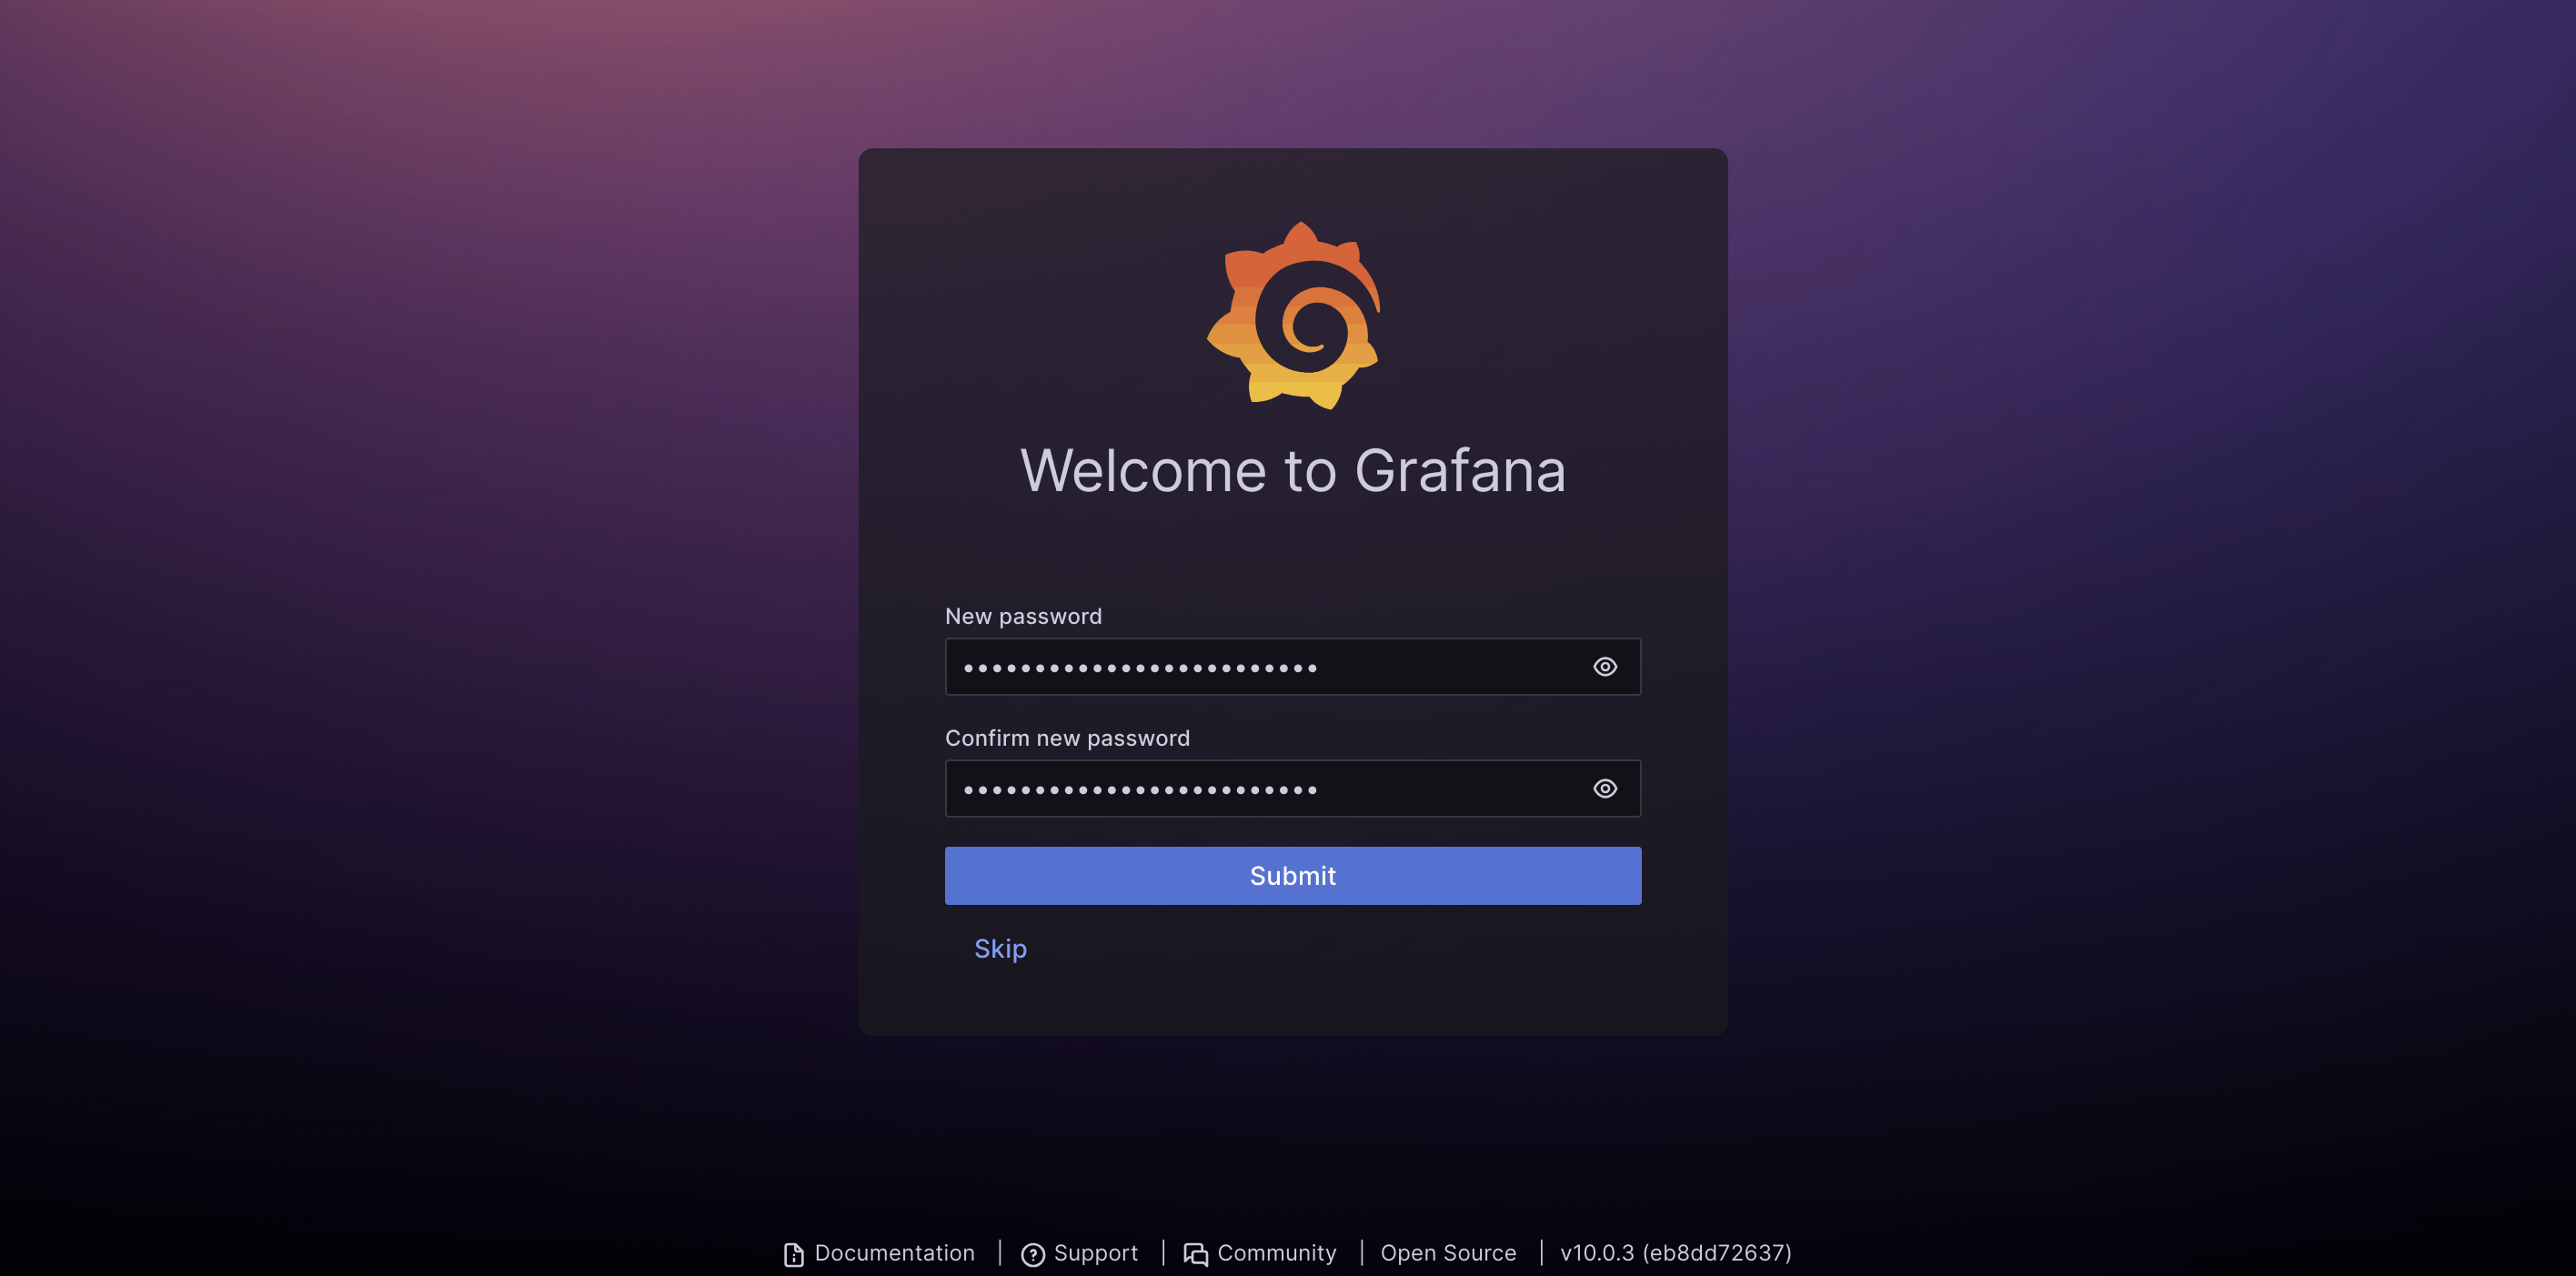
Once you've provided a new password, you will be redirected to the default Grafana landing page:
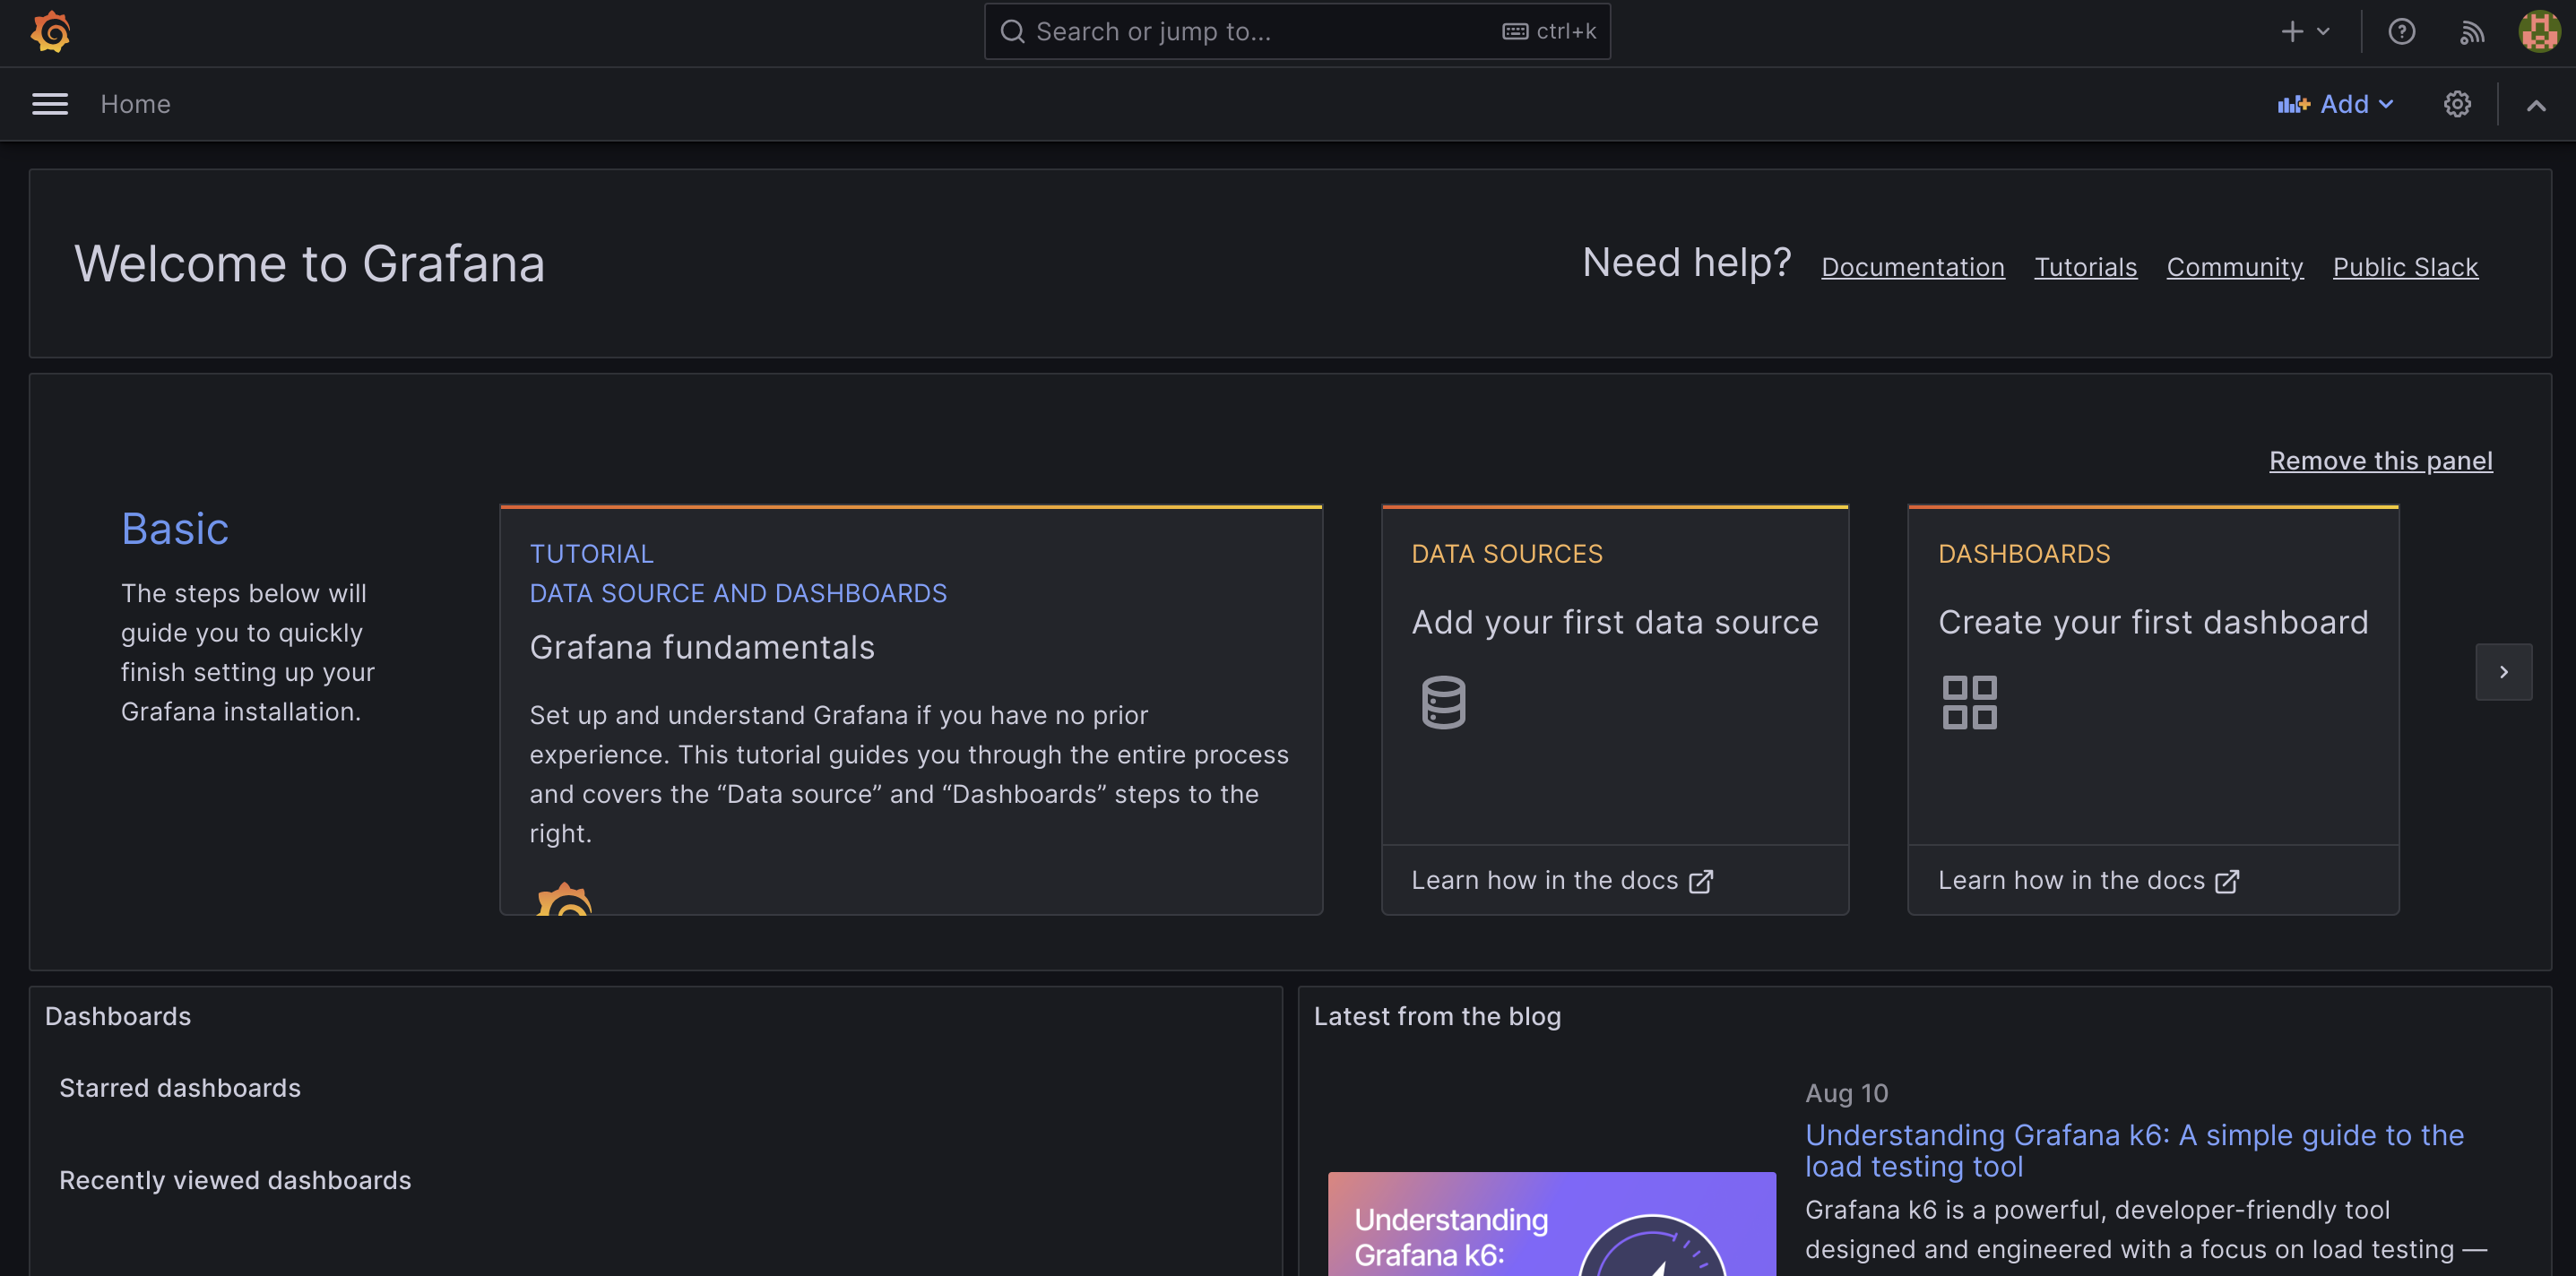
From here, you can modify settings and begin configuring your instance.
Creating a GitHub personal access token
To test that Grafana can connect to and visualize data from a data source, we will connect our instance with a GitHub account.
To do this, you'll first need to create a GitHub personal access token to authenticate to your account.
On GitHub, visit the Settings and click the Developer settings tab on the left-hand sidebar. Next, open the Personal access tokens menu and click Tokens (classic).
To create a new token, click the Generate new token button and select Generate new token (classic) from the drop down menu. Add a name for the new token and adjust the expiration date to your preference.
In the scopes selection, select the following items:
reporead:packagesread:useruser:email
Click the Generate token button when you're done. Copy the generated token and save it to use for the next step.
Connecting Grafana with GitHub
Now that we have a GitHub personal access token, we can configure the GitHub data source plugin for Grafana to visualize our data.
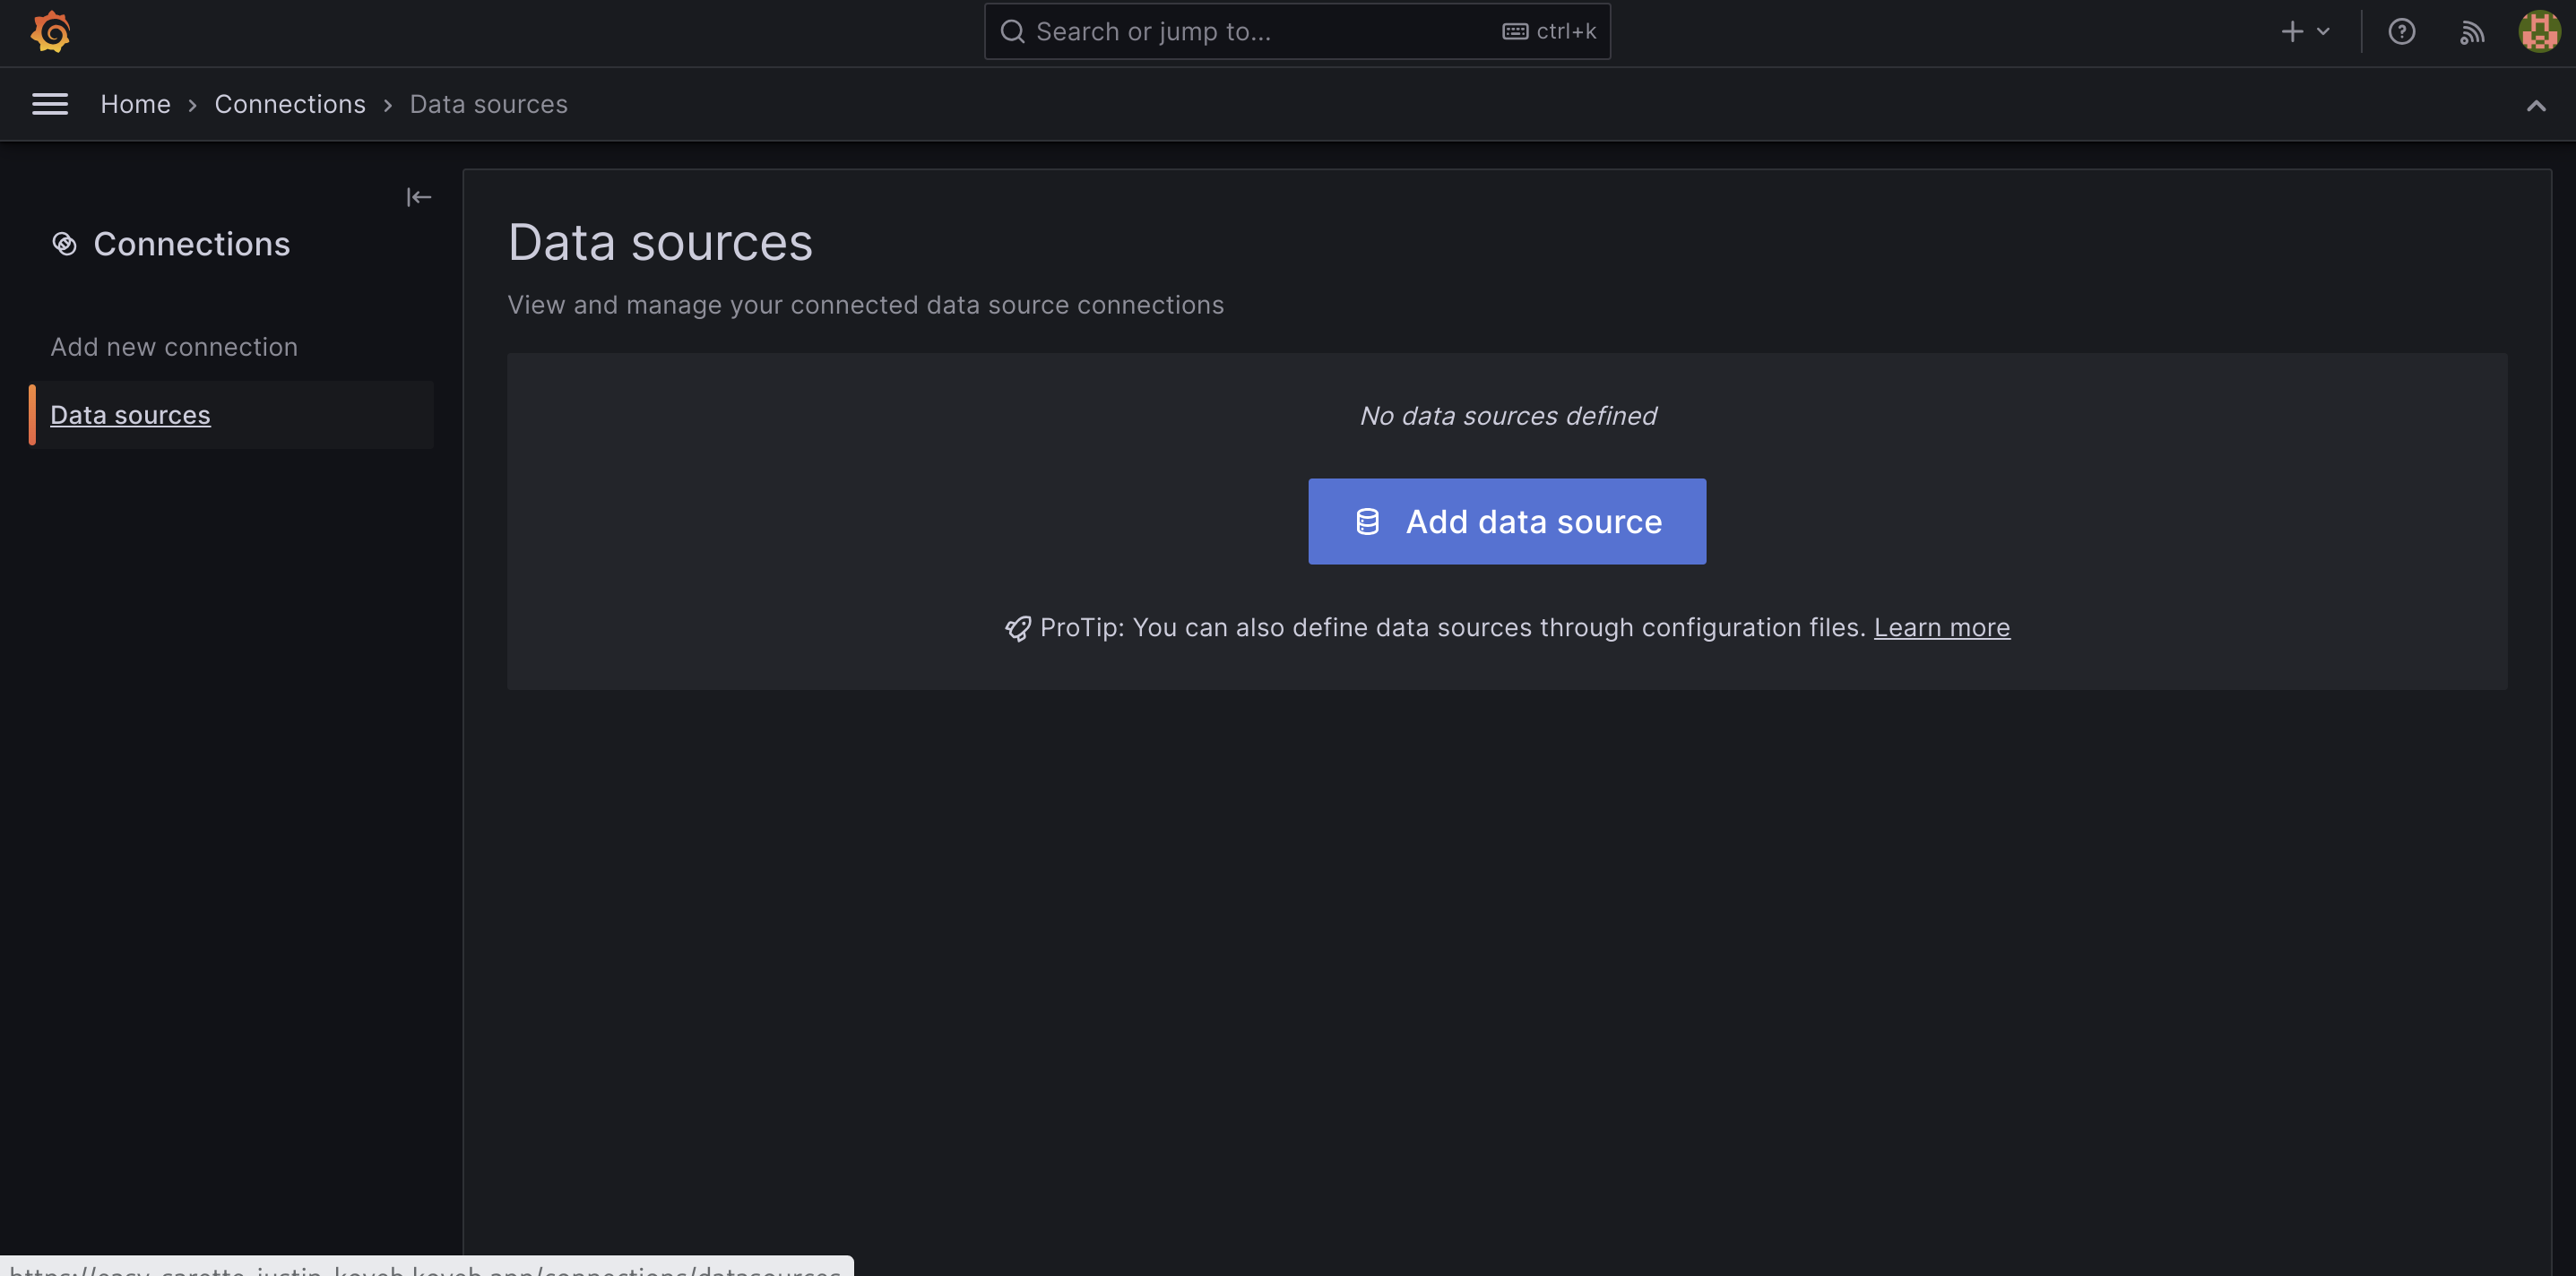
In your Grafana dashboard, open the side menu and select Connections. In the connections menu, view the Data sources page and then click the Add data source button:
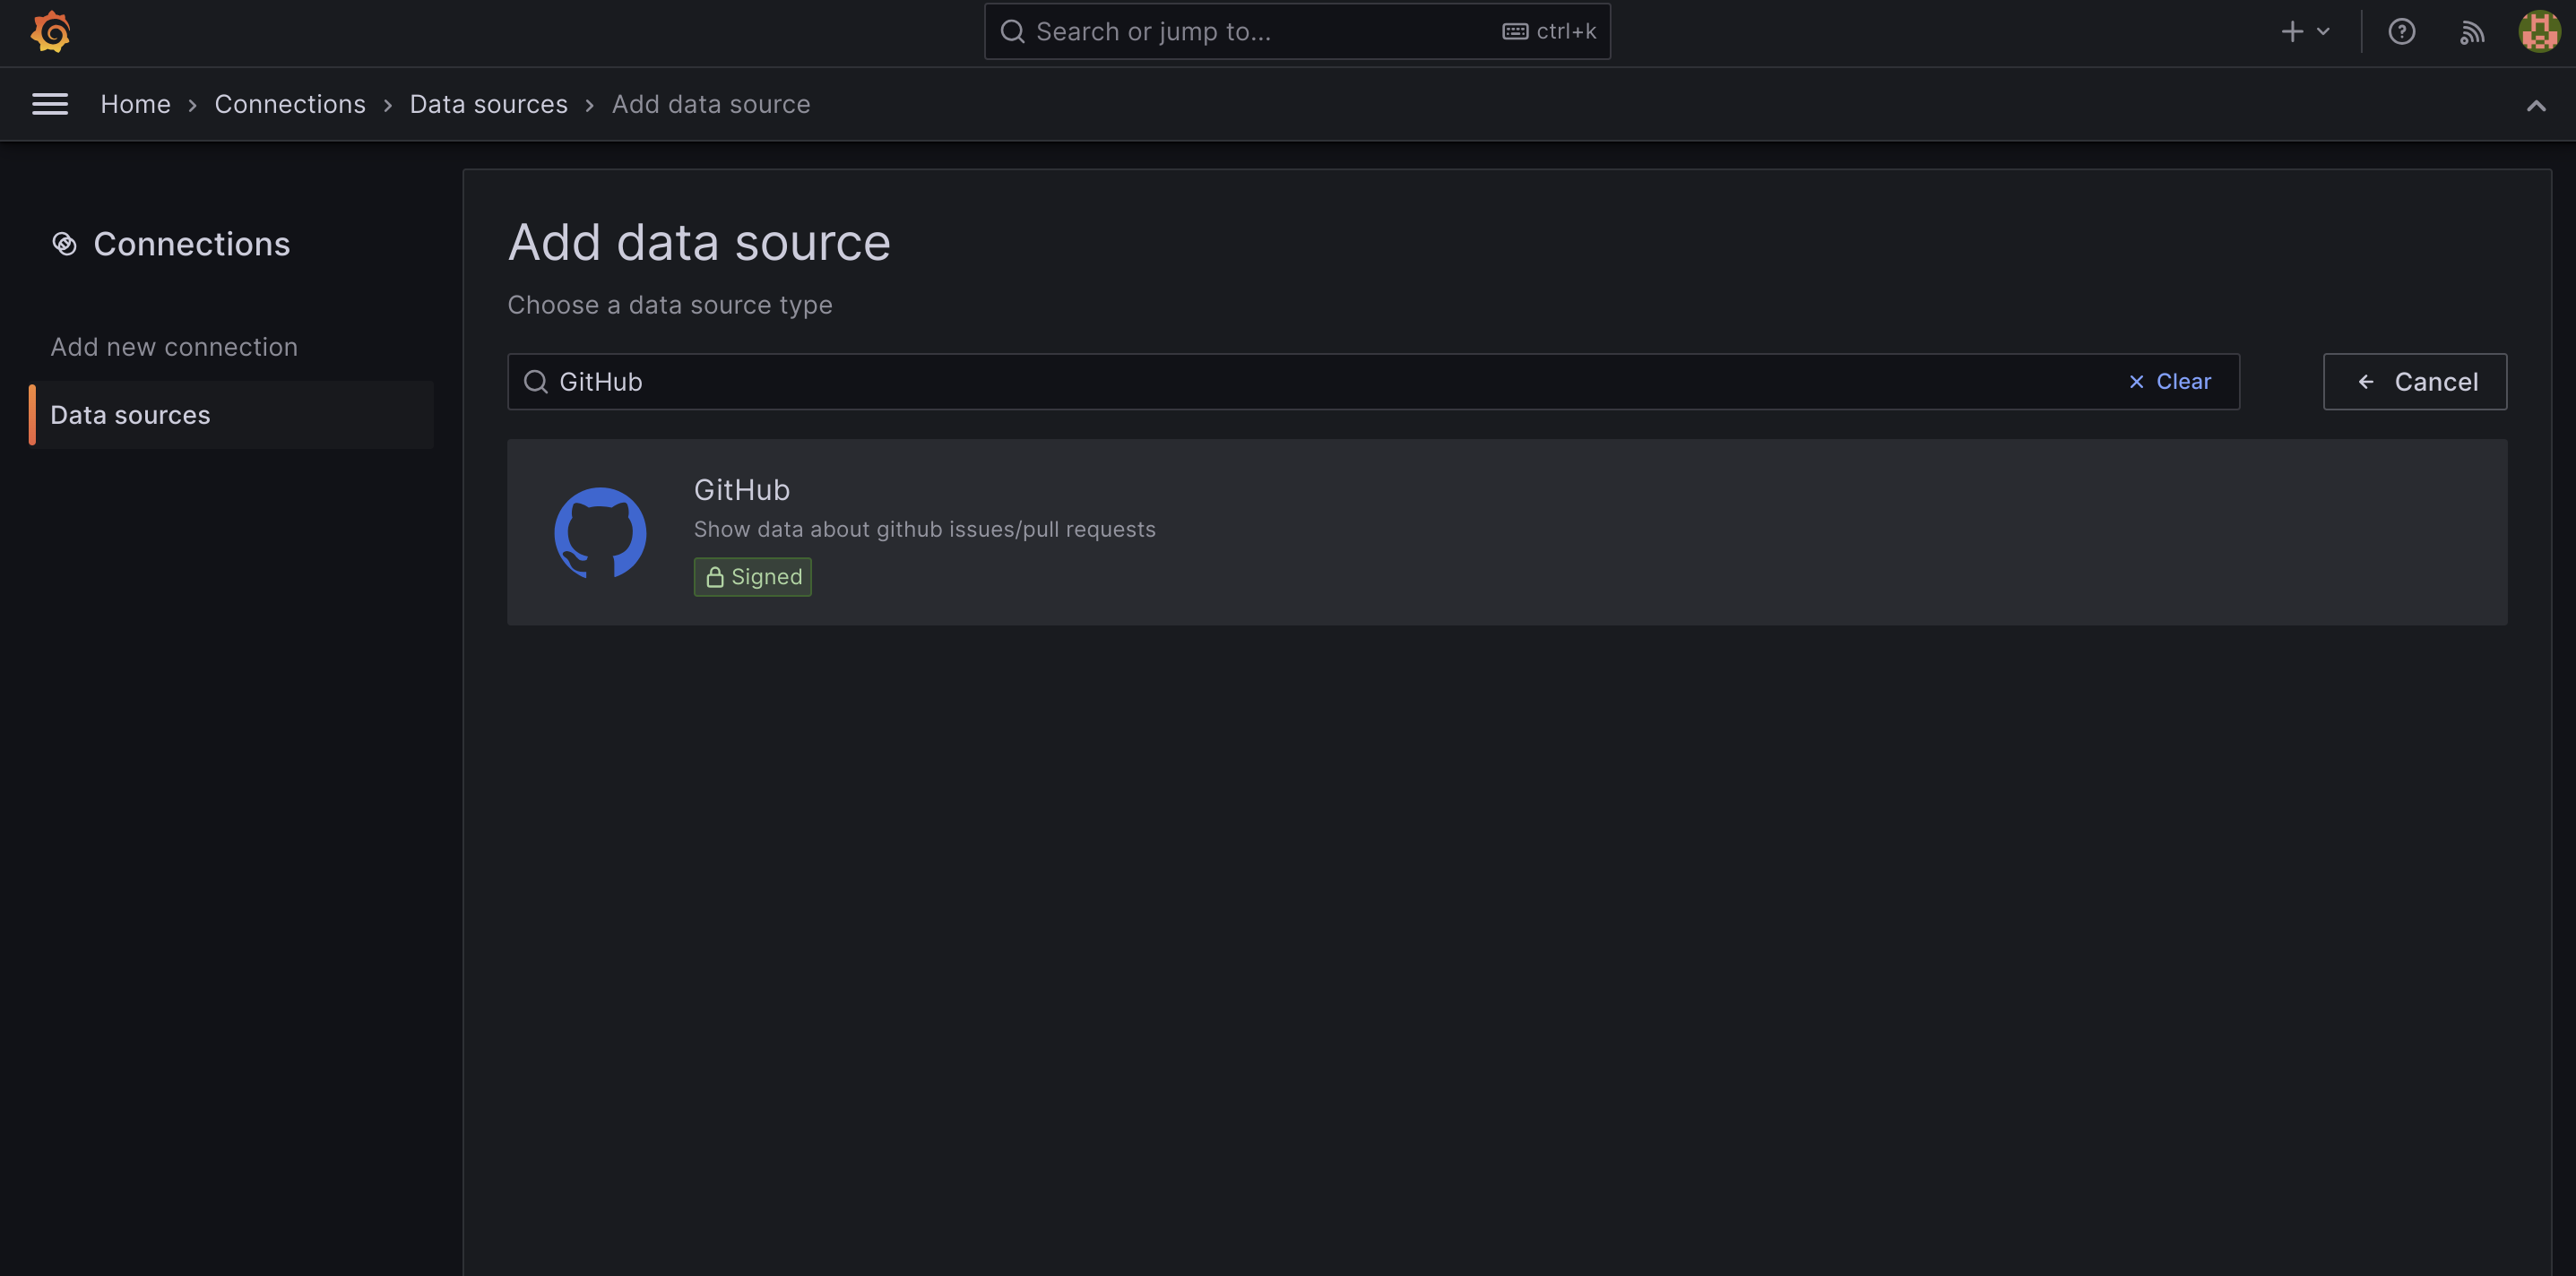
On the next page, use the filter to search for "GitHub" and then select the plugin to continue:
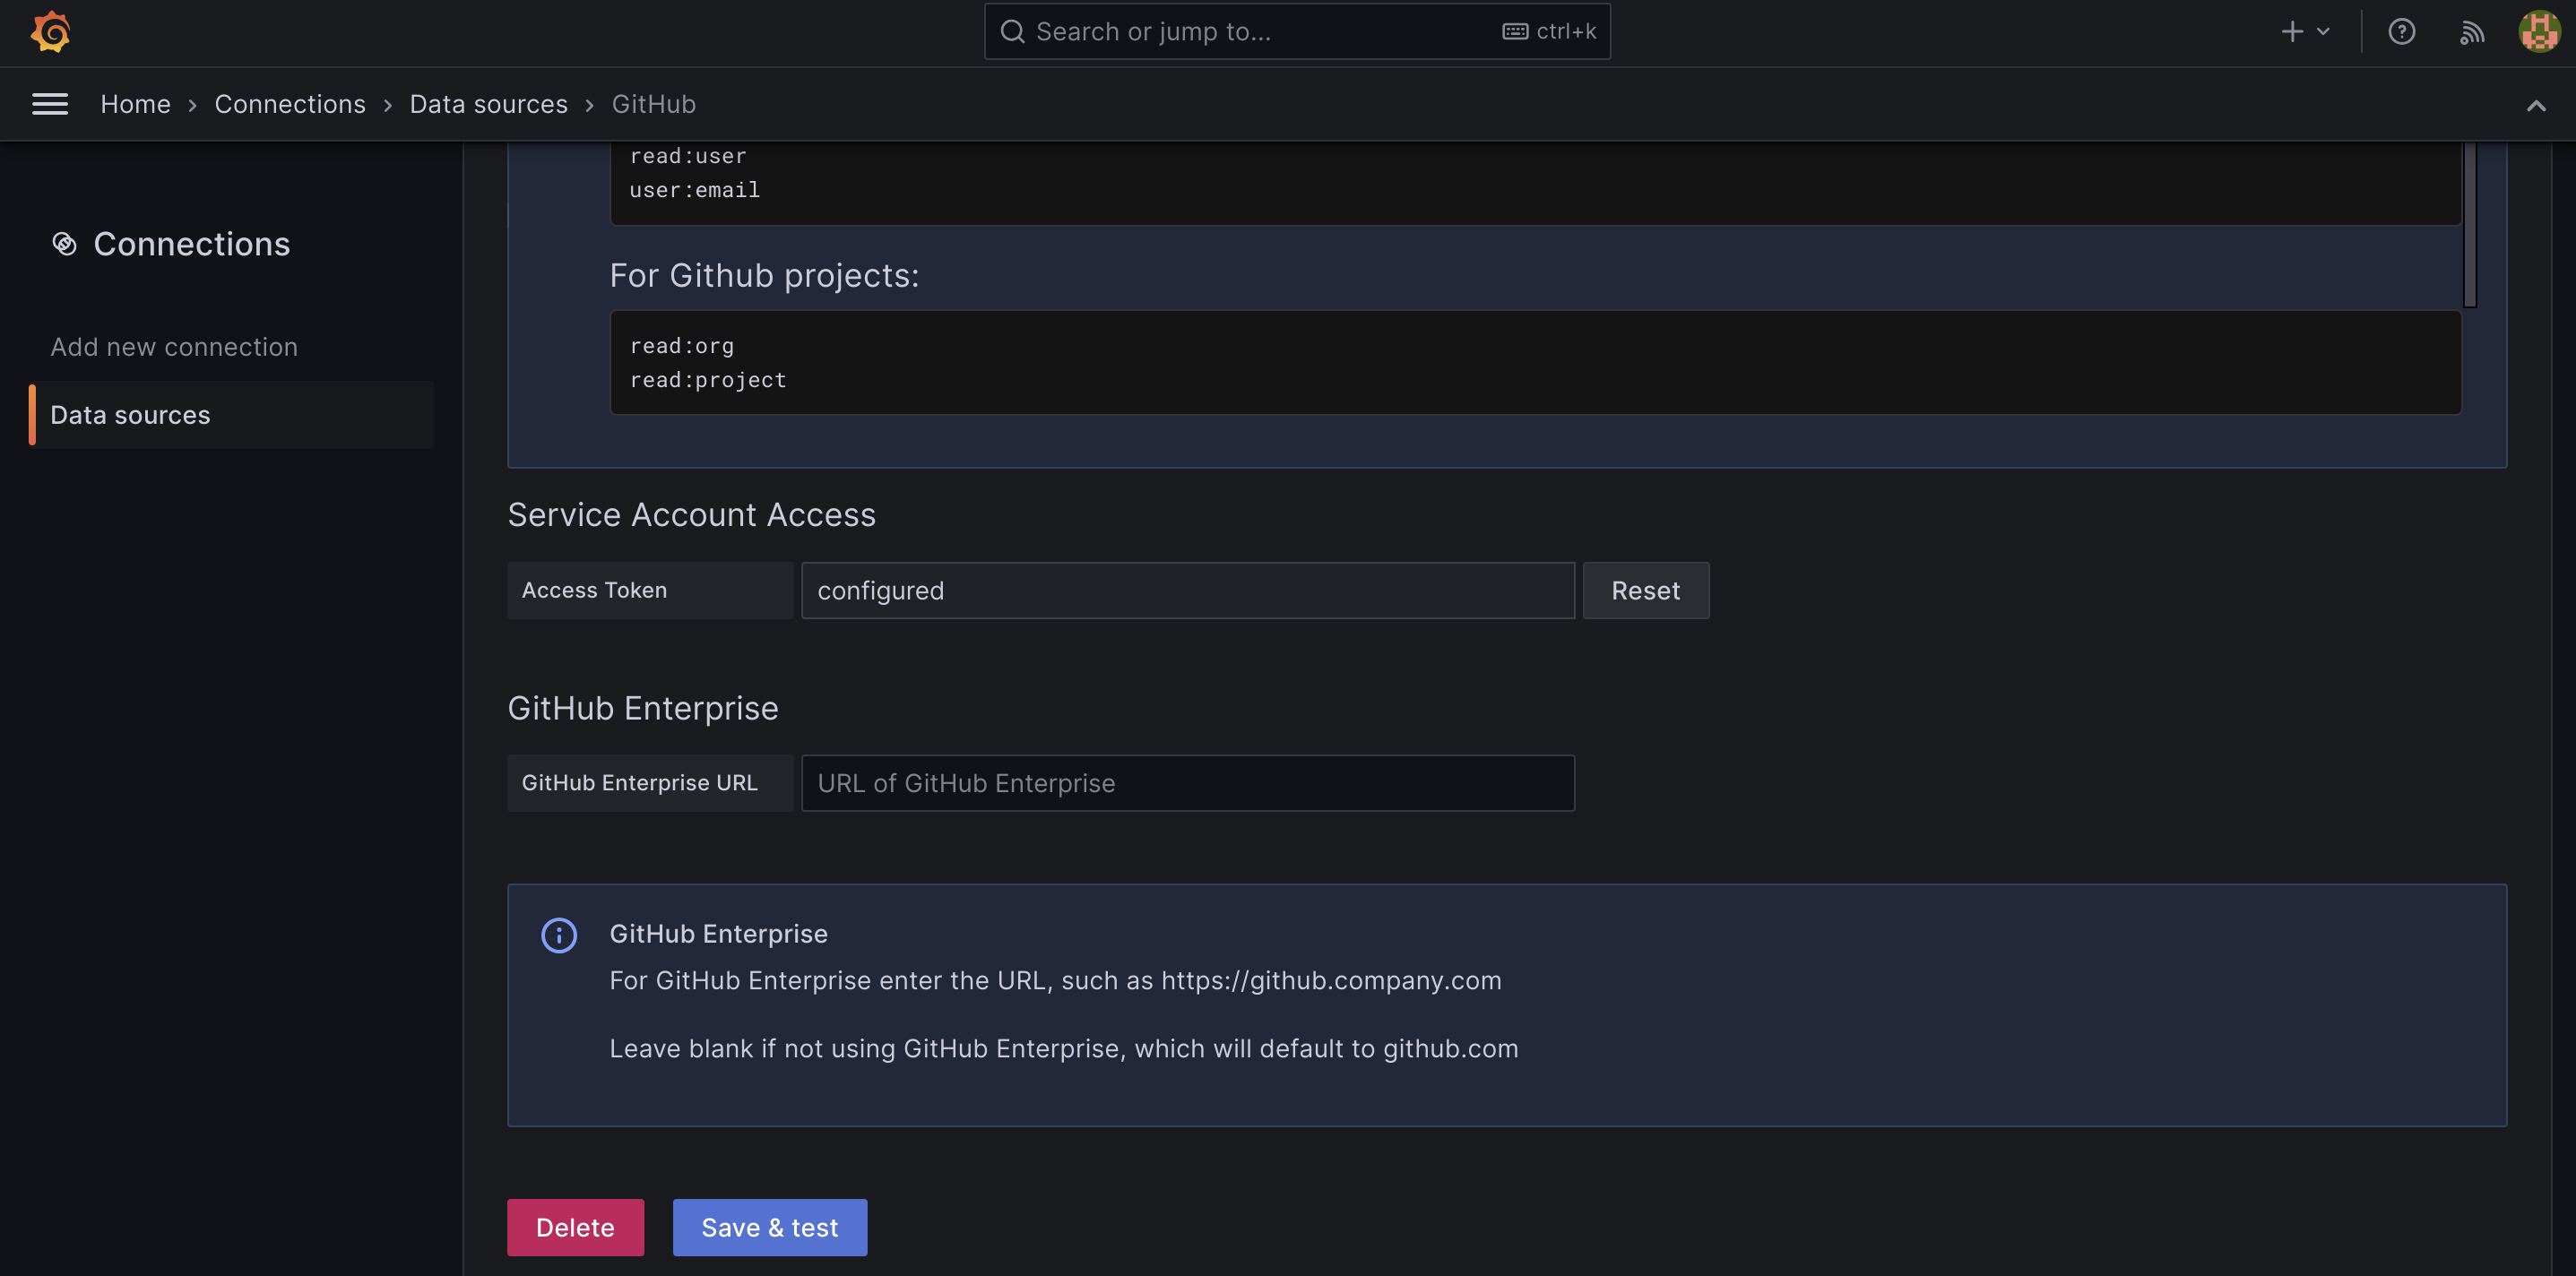
On the page that follows, name the connection so that you can identify this connection accurately. In the Service Account Access section, paste your GitHub personal access token into the Access Token field.
Click the Save & test button to validate the connection and save your configuration:
If everything goes well, you should see a message that the data source is working.
Testing querying and visualizations with the GitHub data source
Now that Grafana is connected to your GitHub account, you can query the data that the GitHub API exposes to visualize changes in repositories, organizations, and more. You can query information about your own repositories as well as any public repositories.
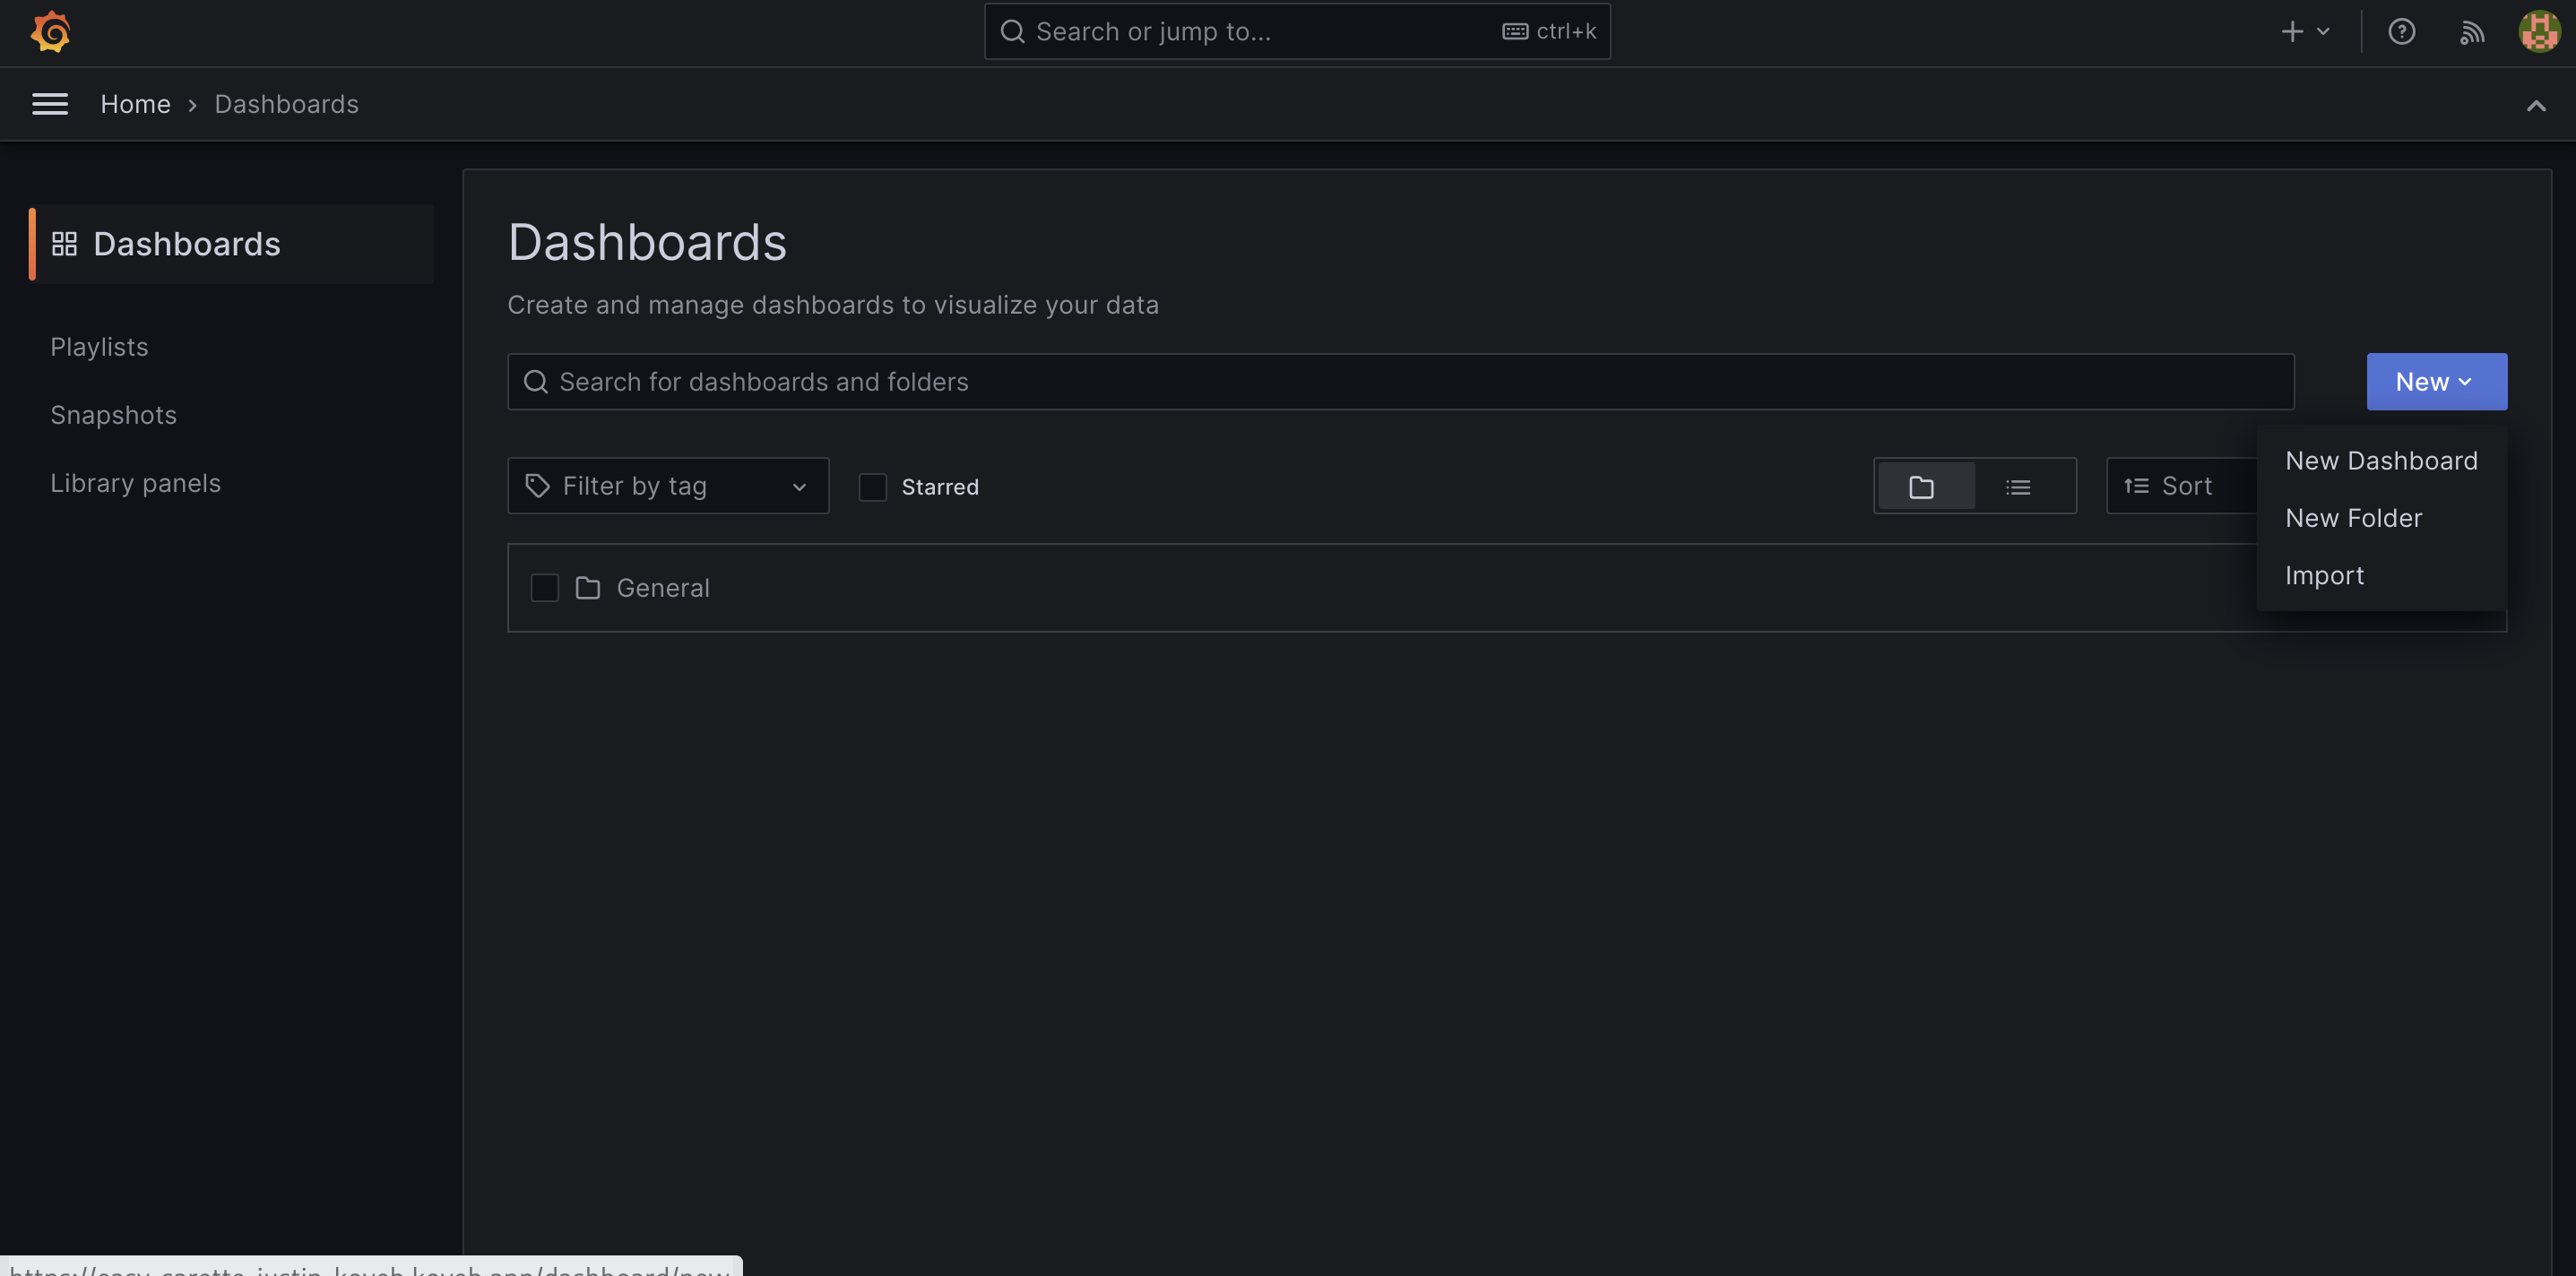
To get started, select Dashboards from the side menu, click the New button, and select New Dashboard:
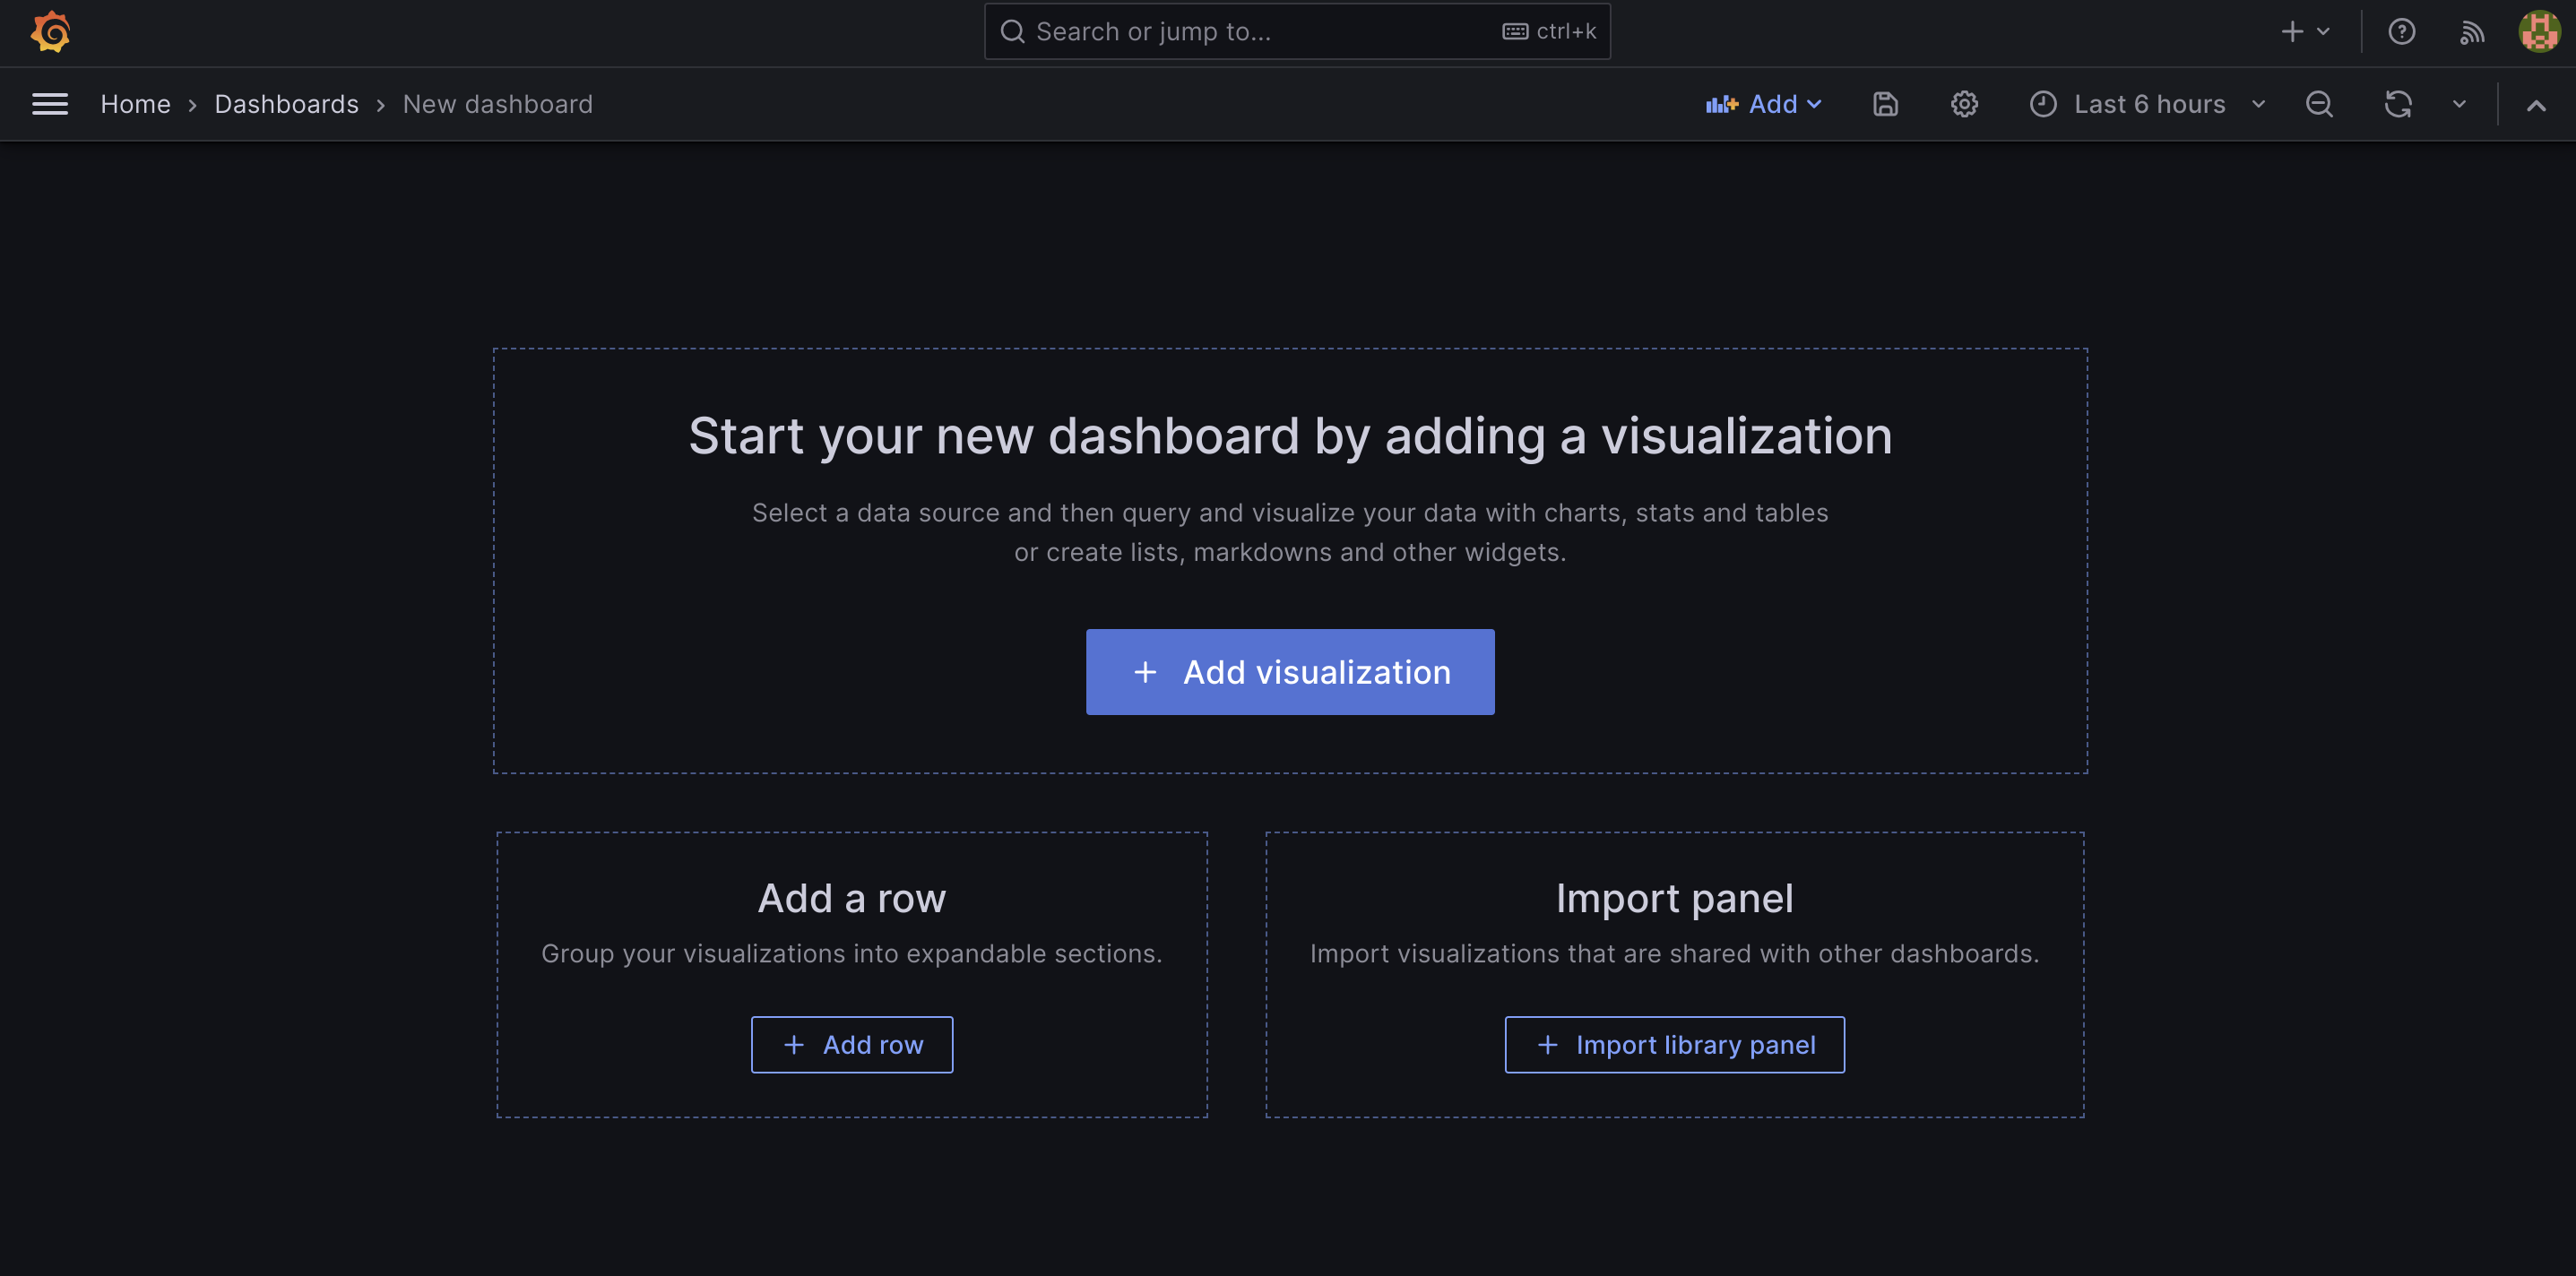
On the next page click the Add visualization button:
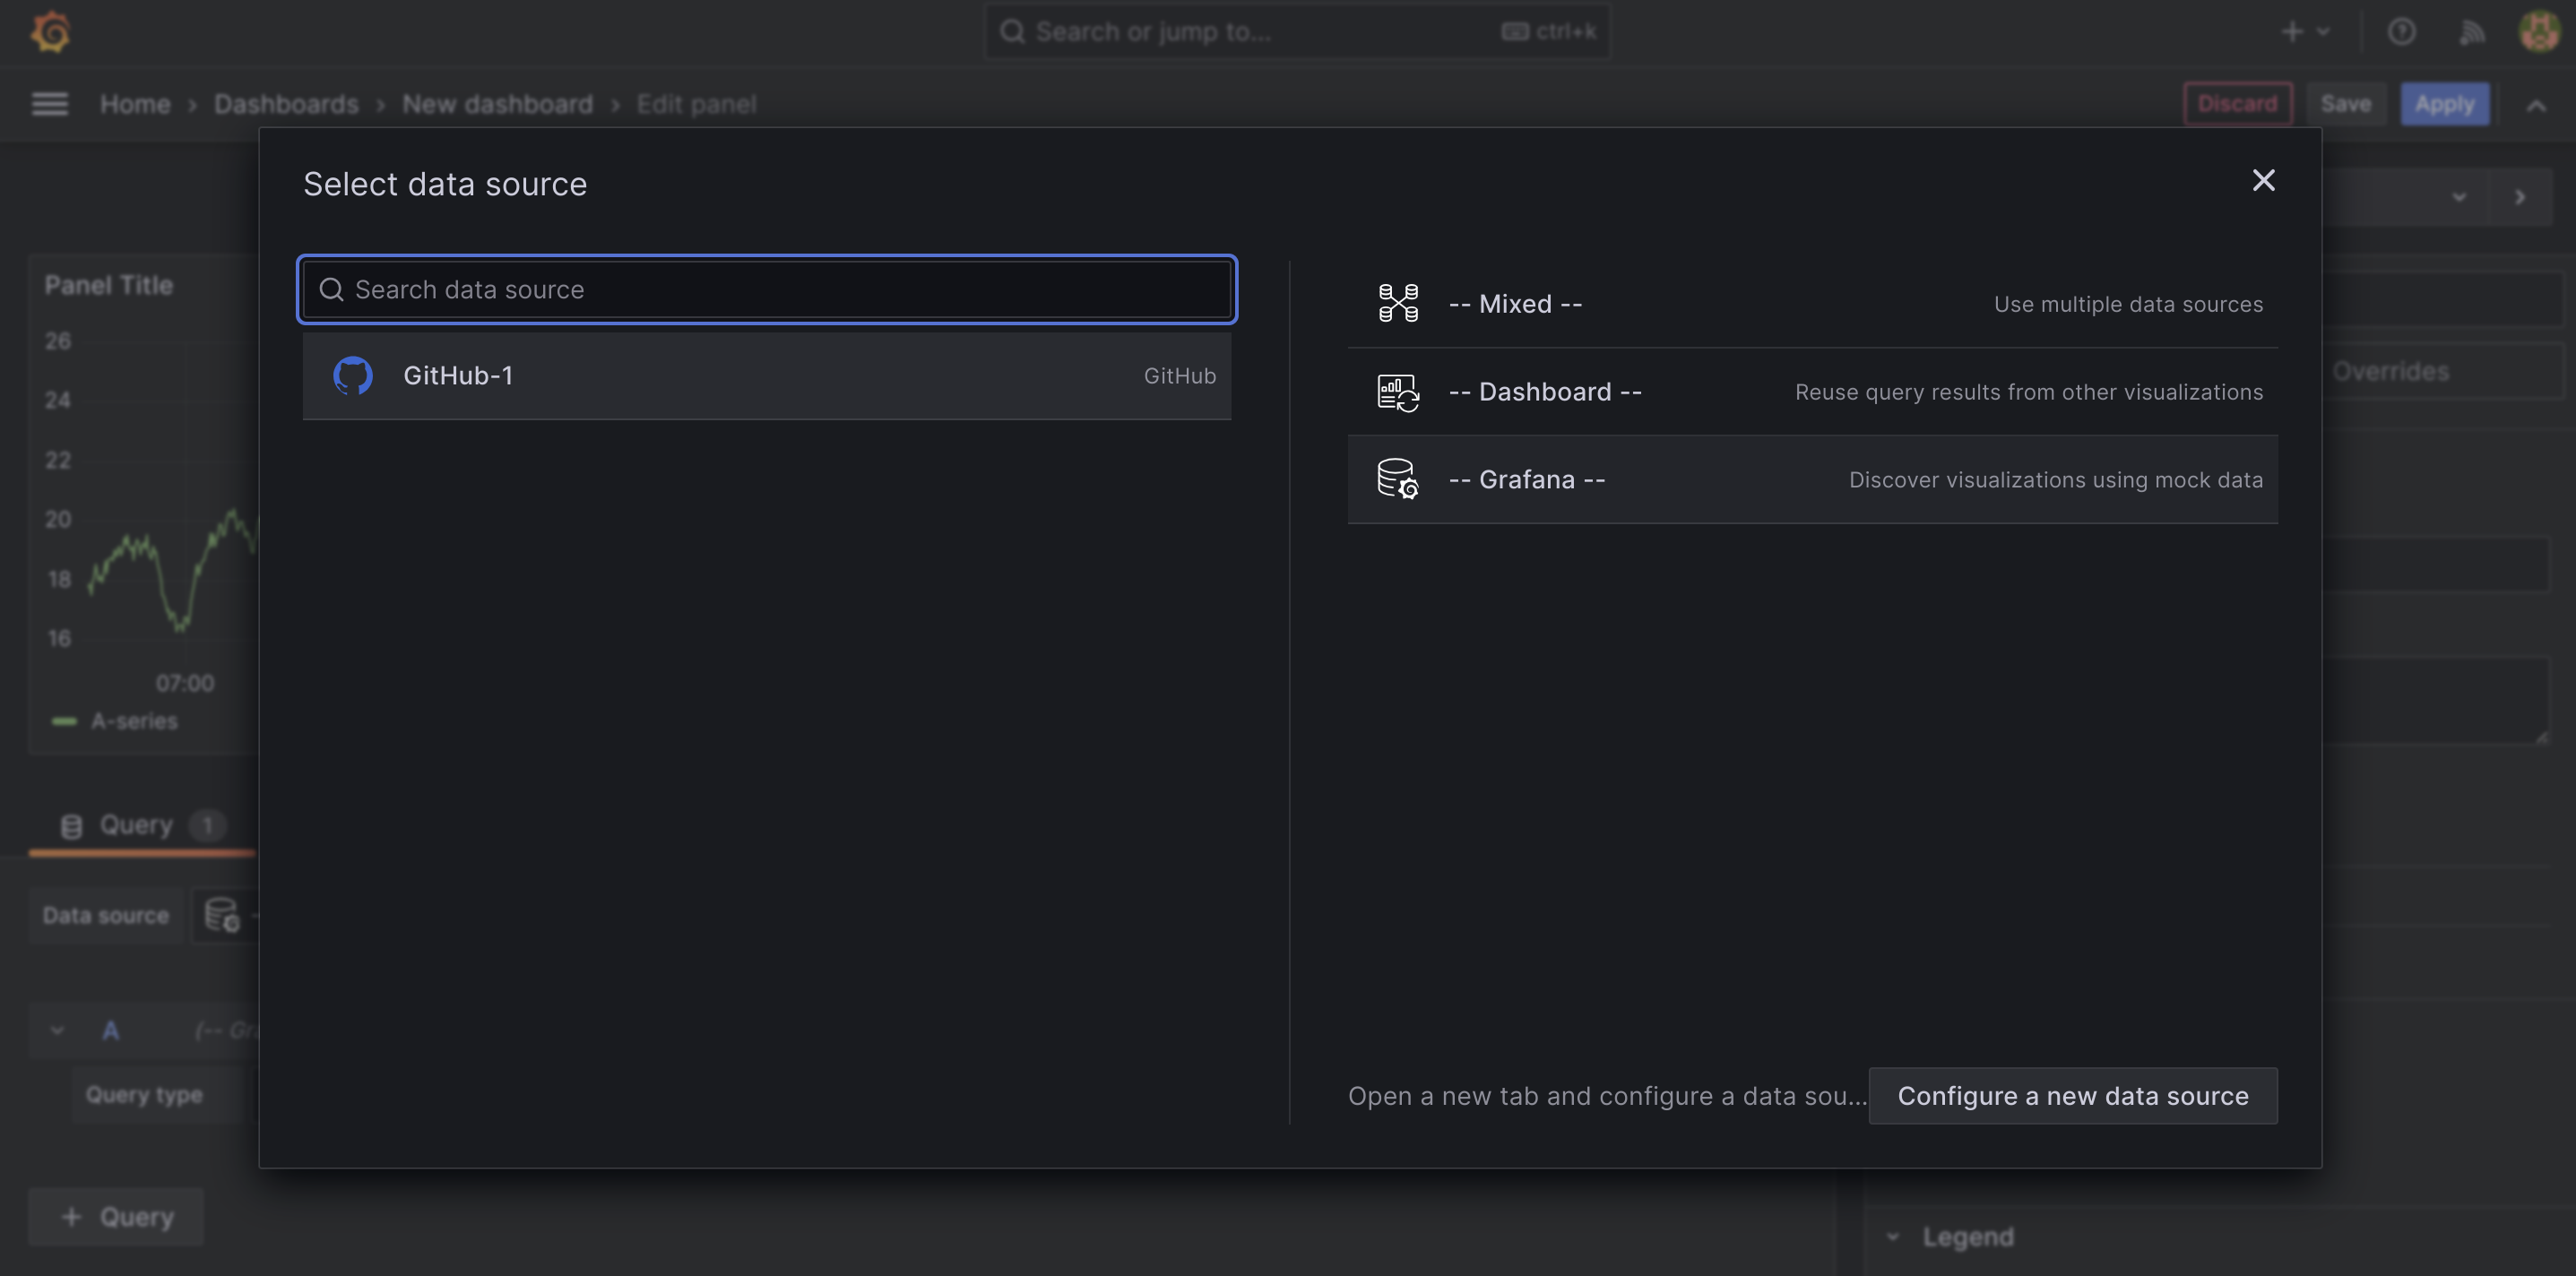
Select your configured GitHub source as the data source:
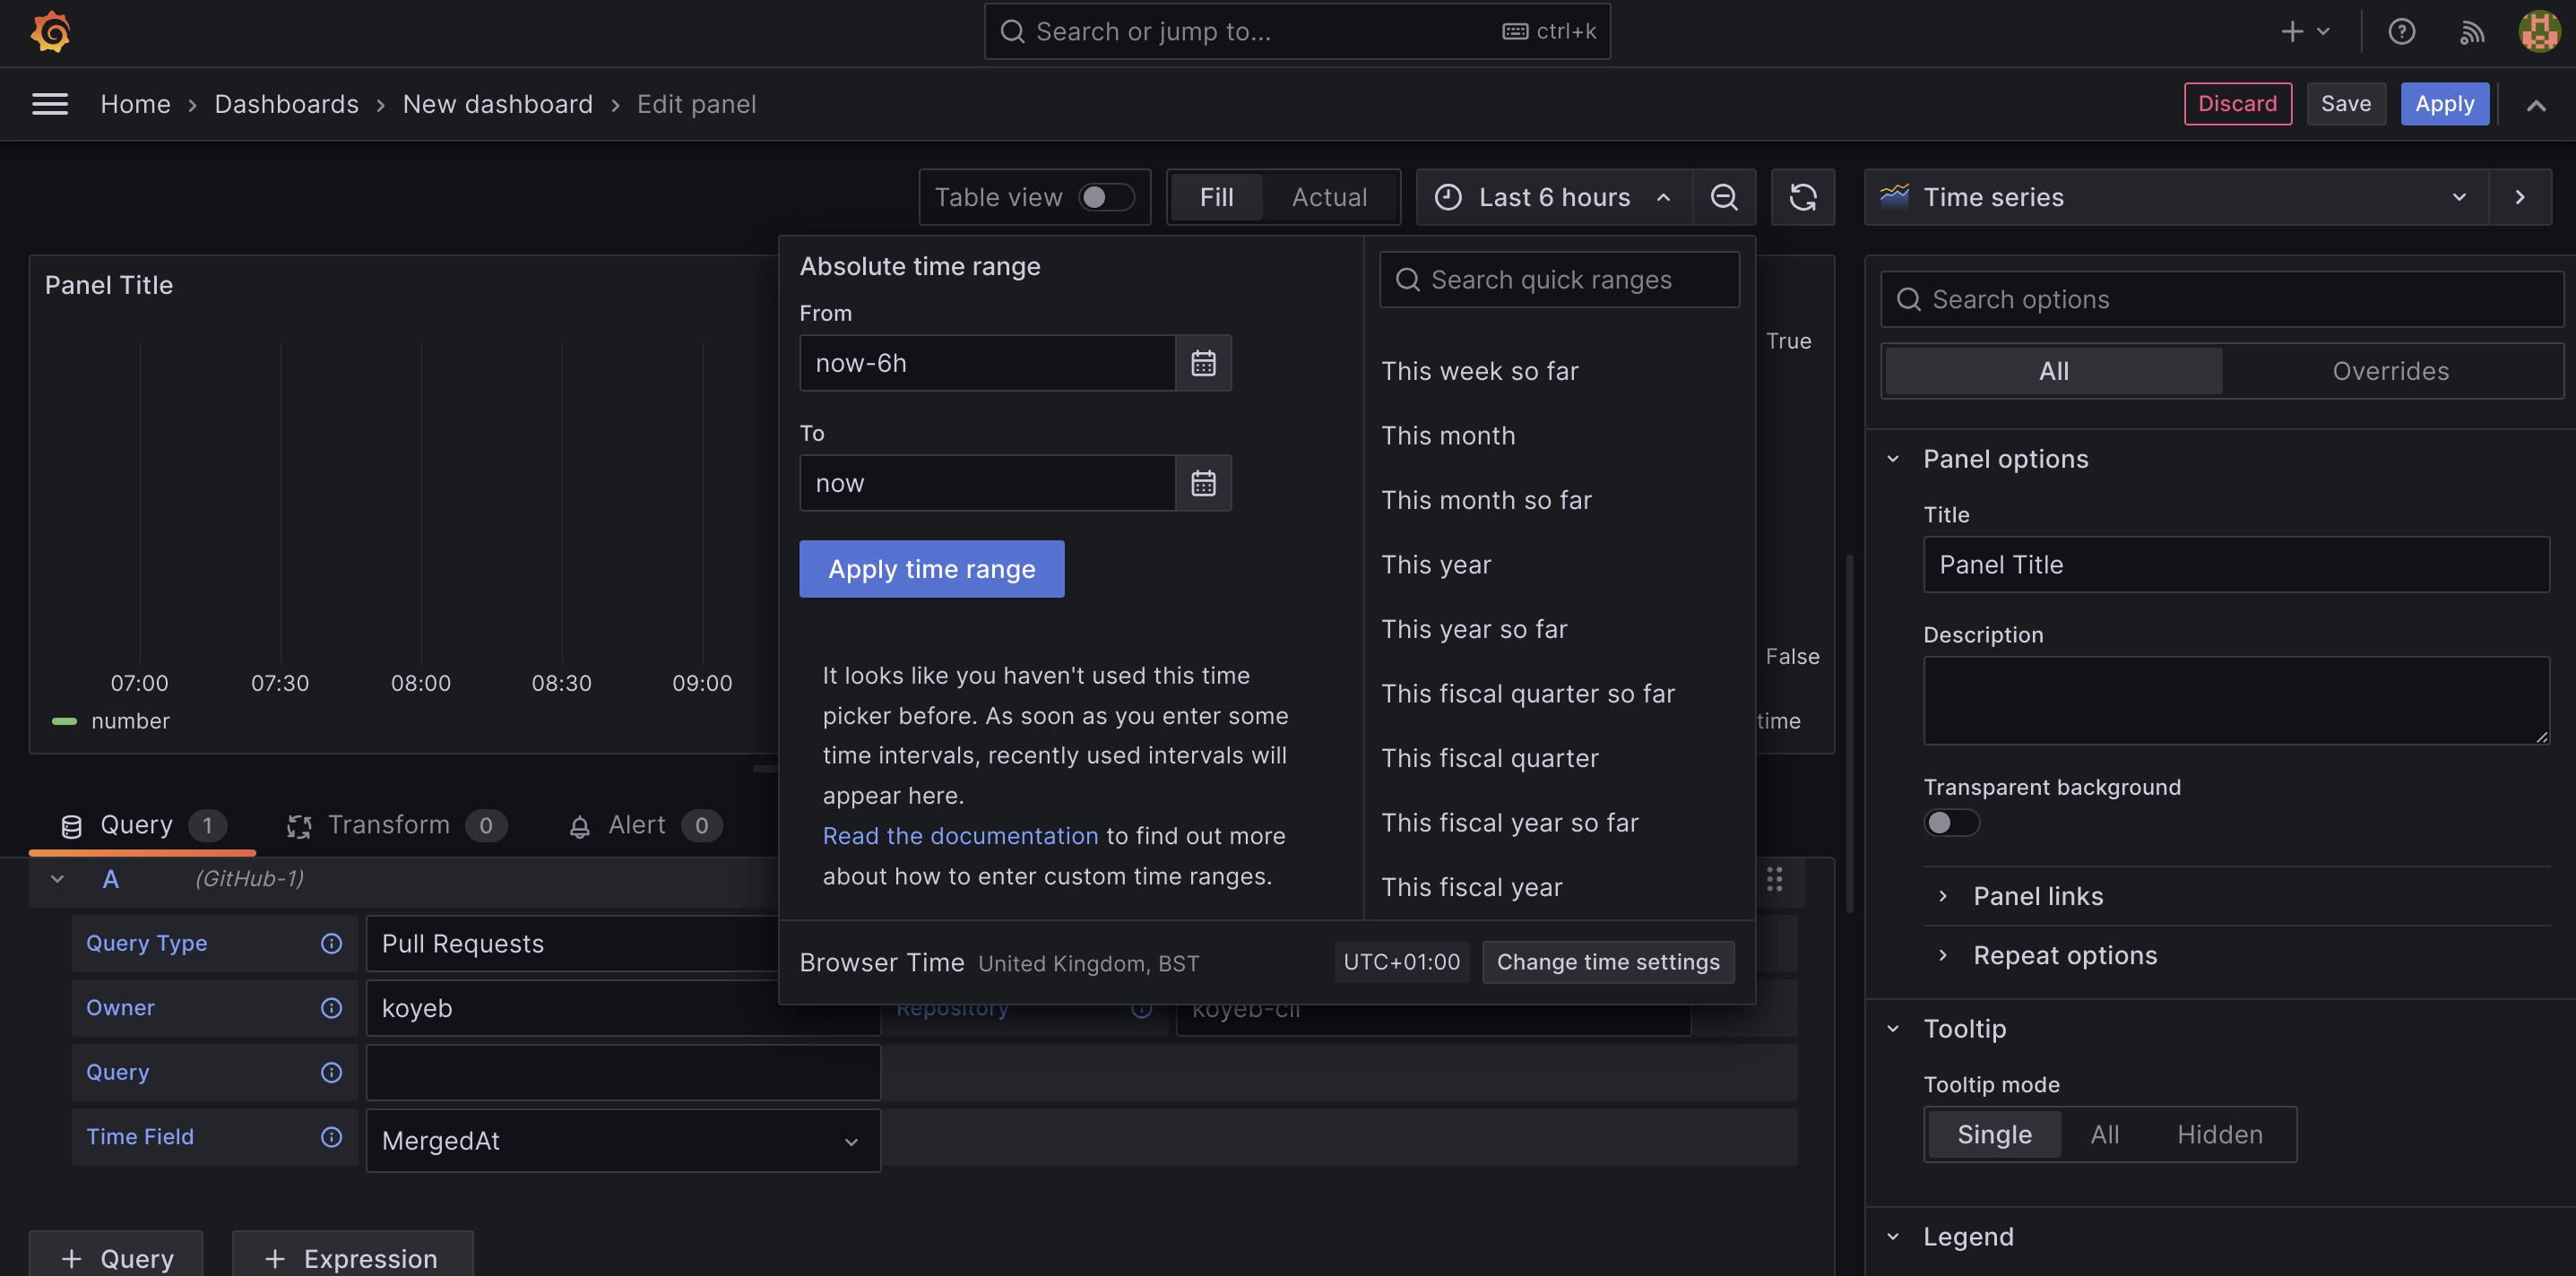
Towards the bottom of the page, you can configure your query. For this example, we'll use the following values:
- Query Type: Pull Requests
- Owner:
koyeb - Repository:
koyeb-cli - Query: (blank)
- Time Field:
MergedAt
Next, above the graph area, adjust the time frame from "Last 6 hours" to "This year so far":
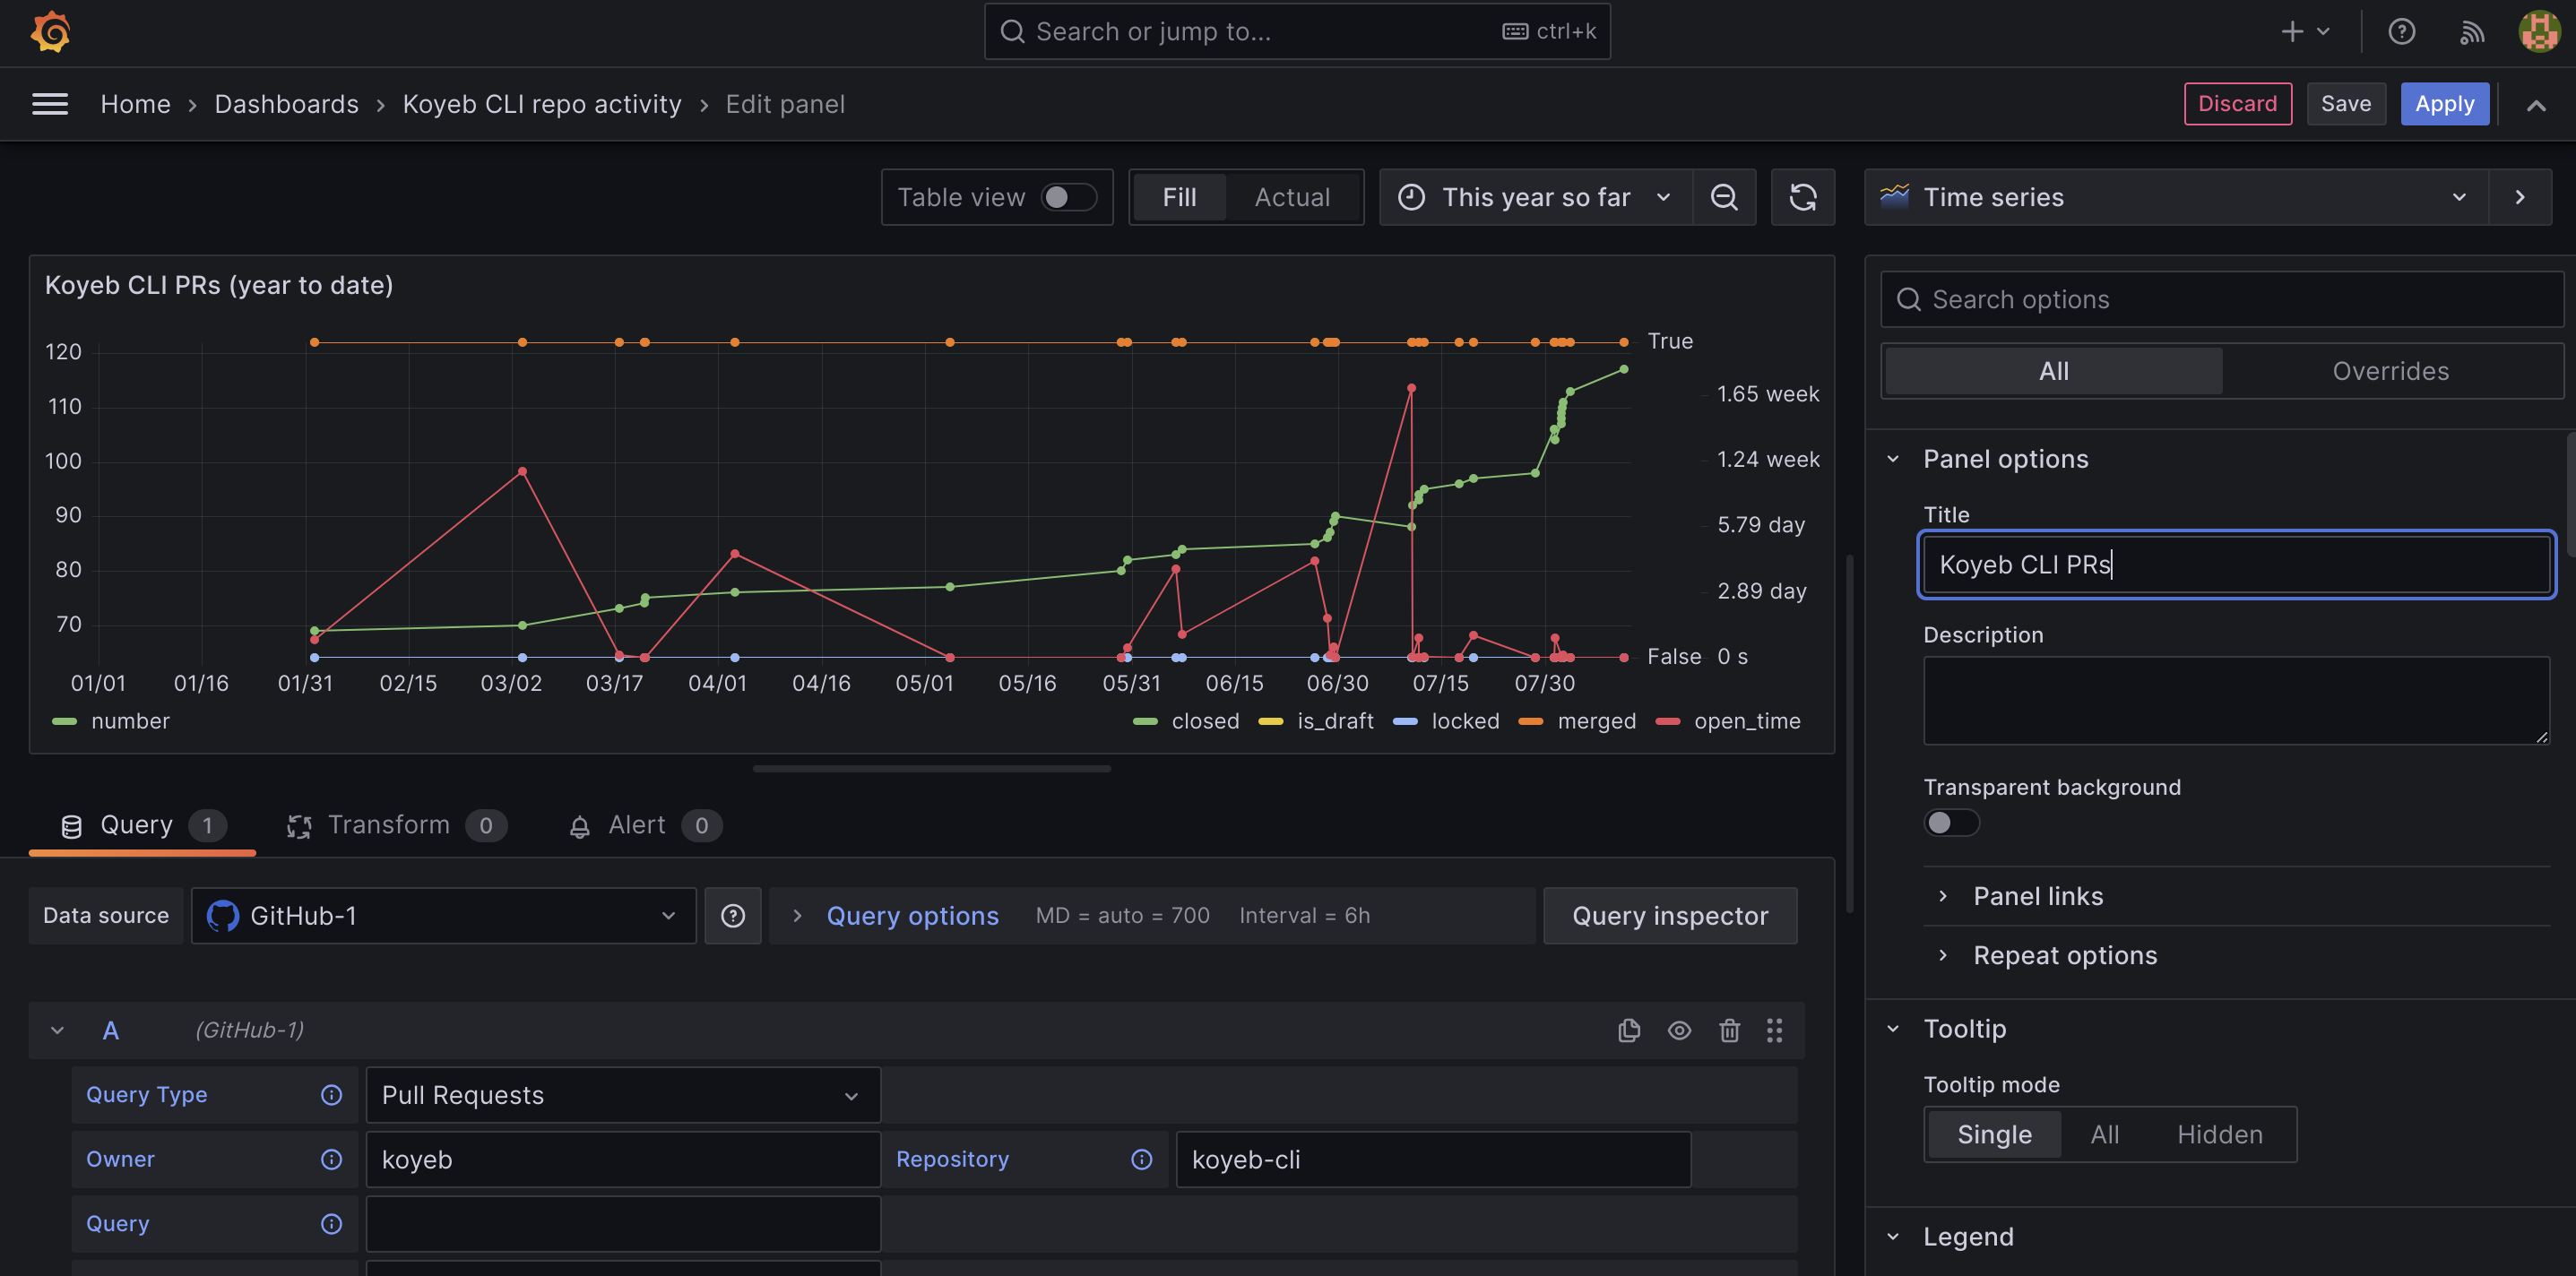
You should see the query run and the visualization populate.
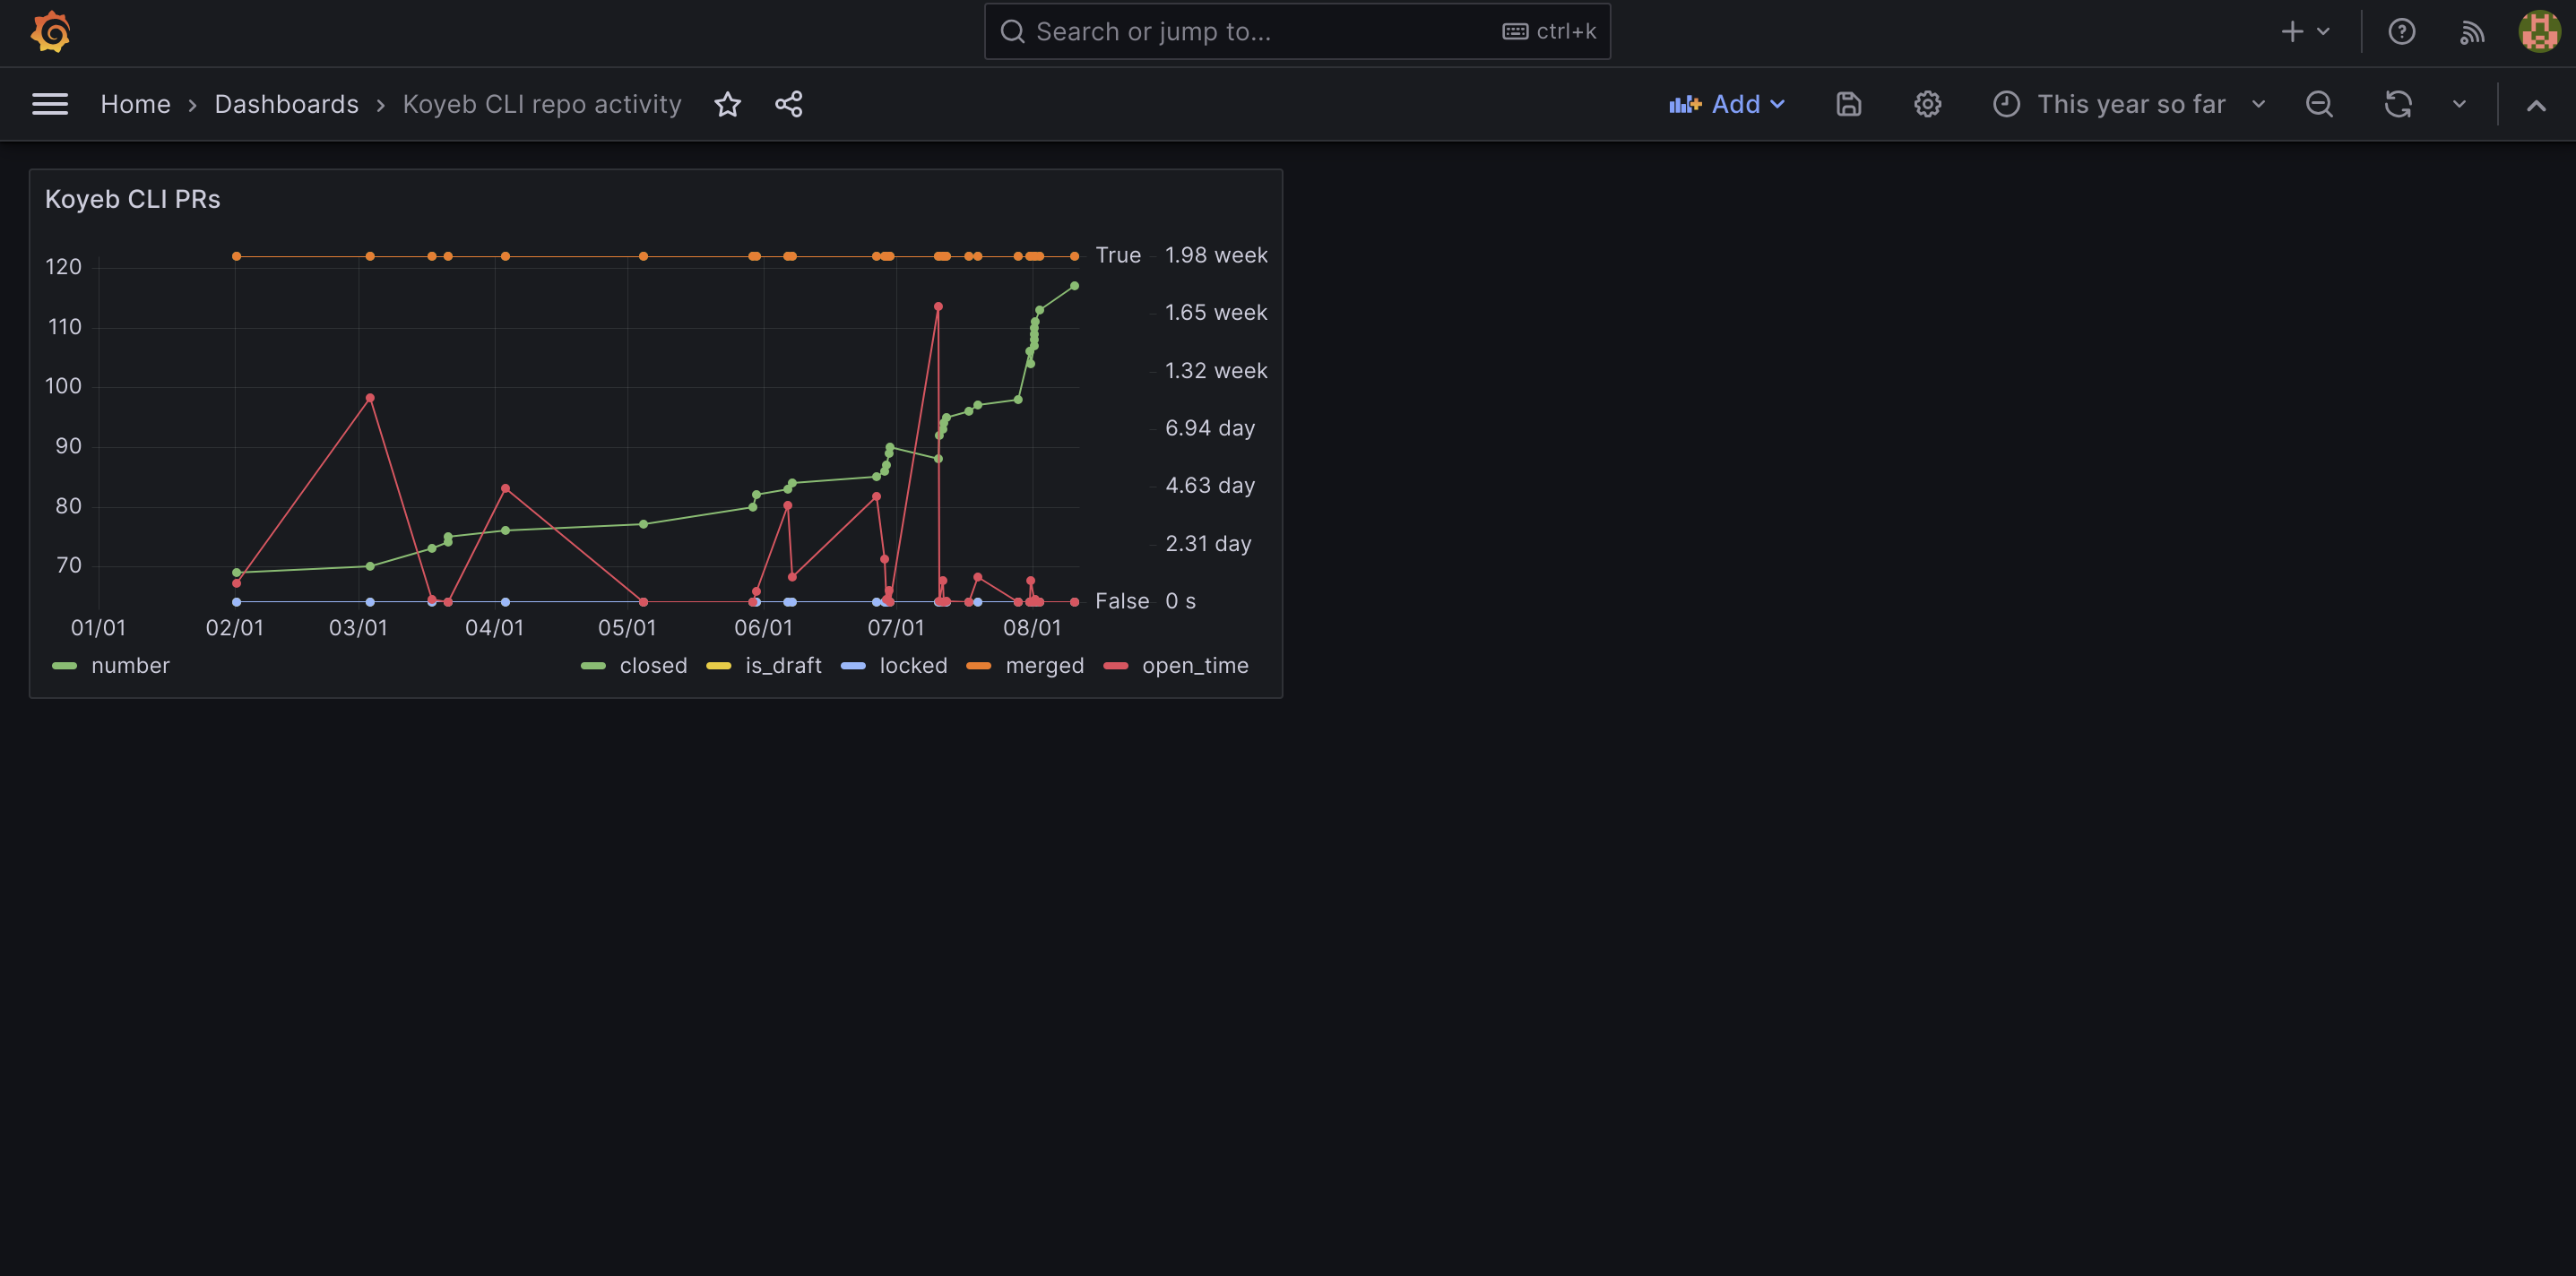
Next, in the side bar, name the visualization "Koyeb CLI PRs" and click the Apply button:
You should now see the new visualization on the dashboard:
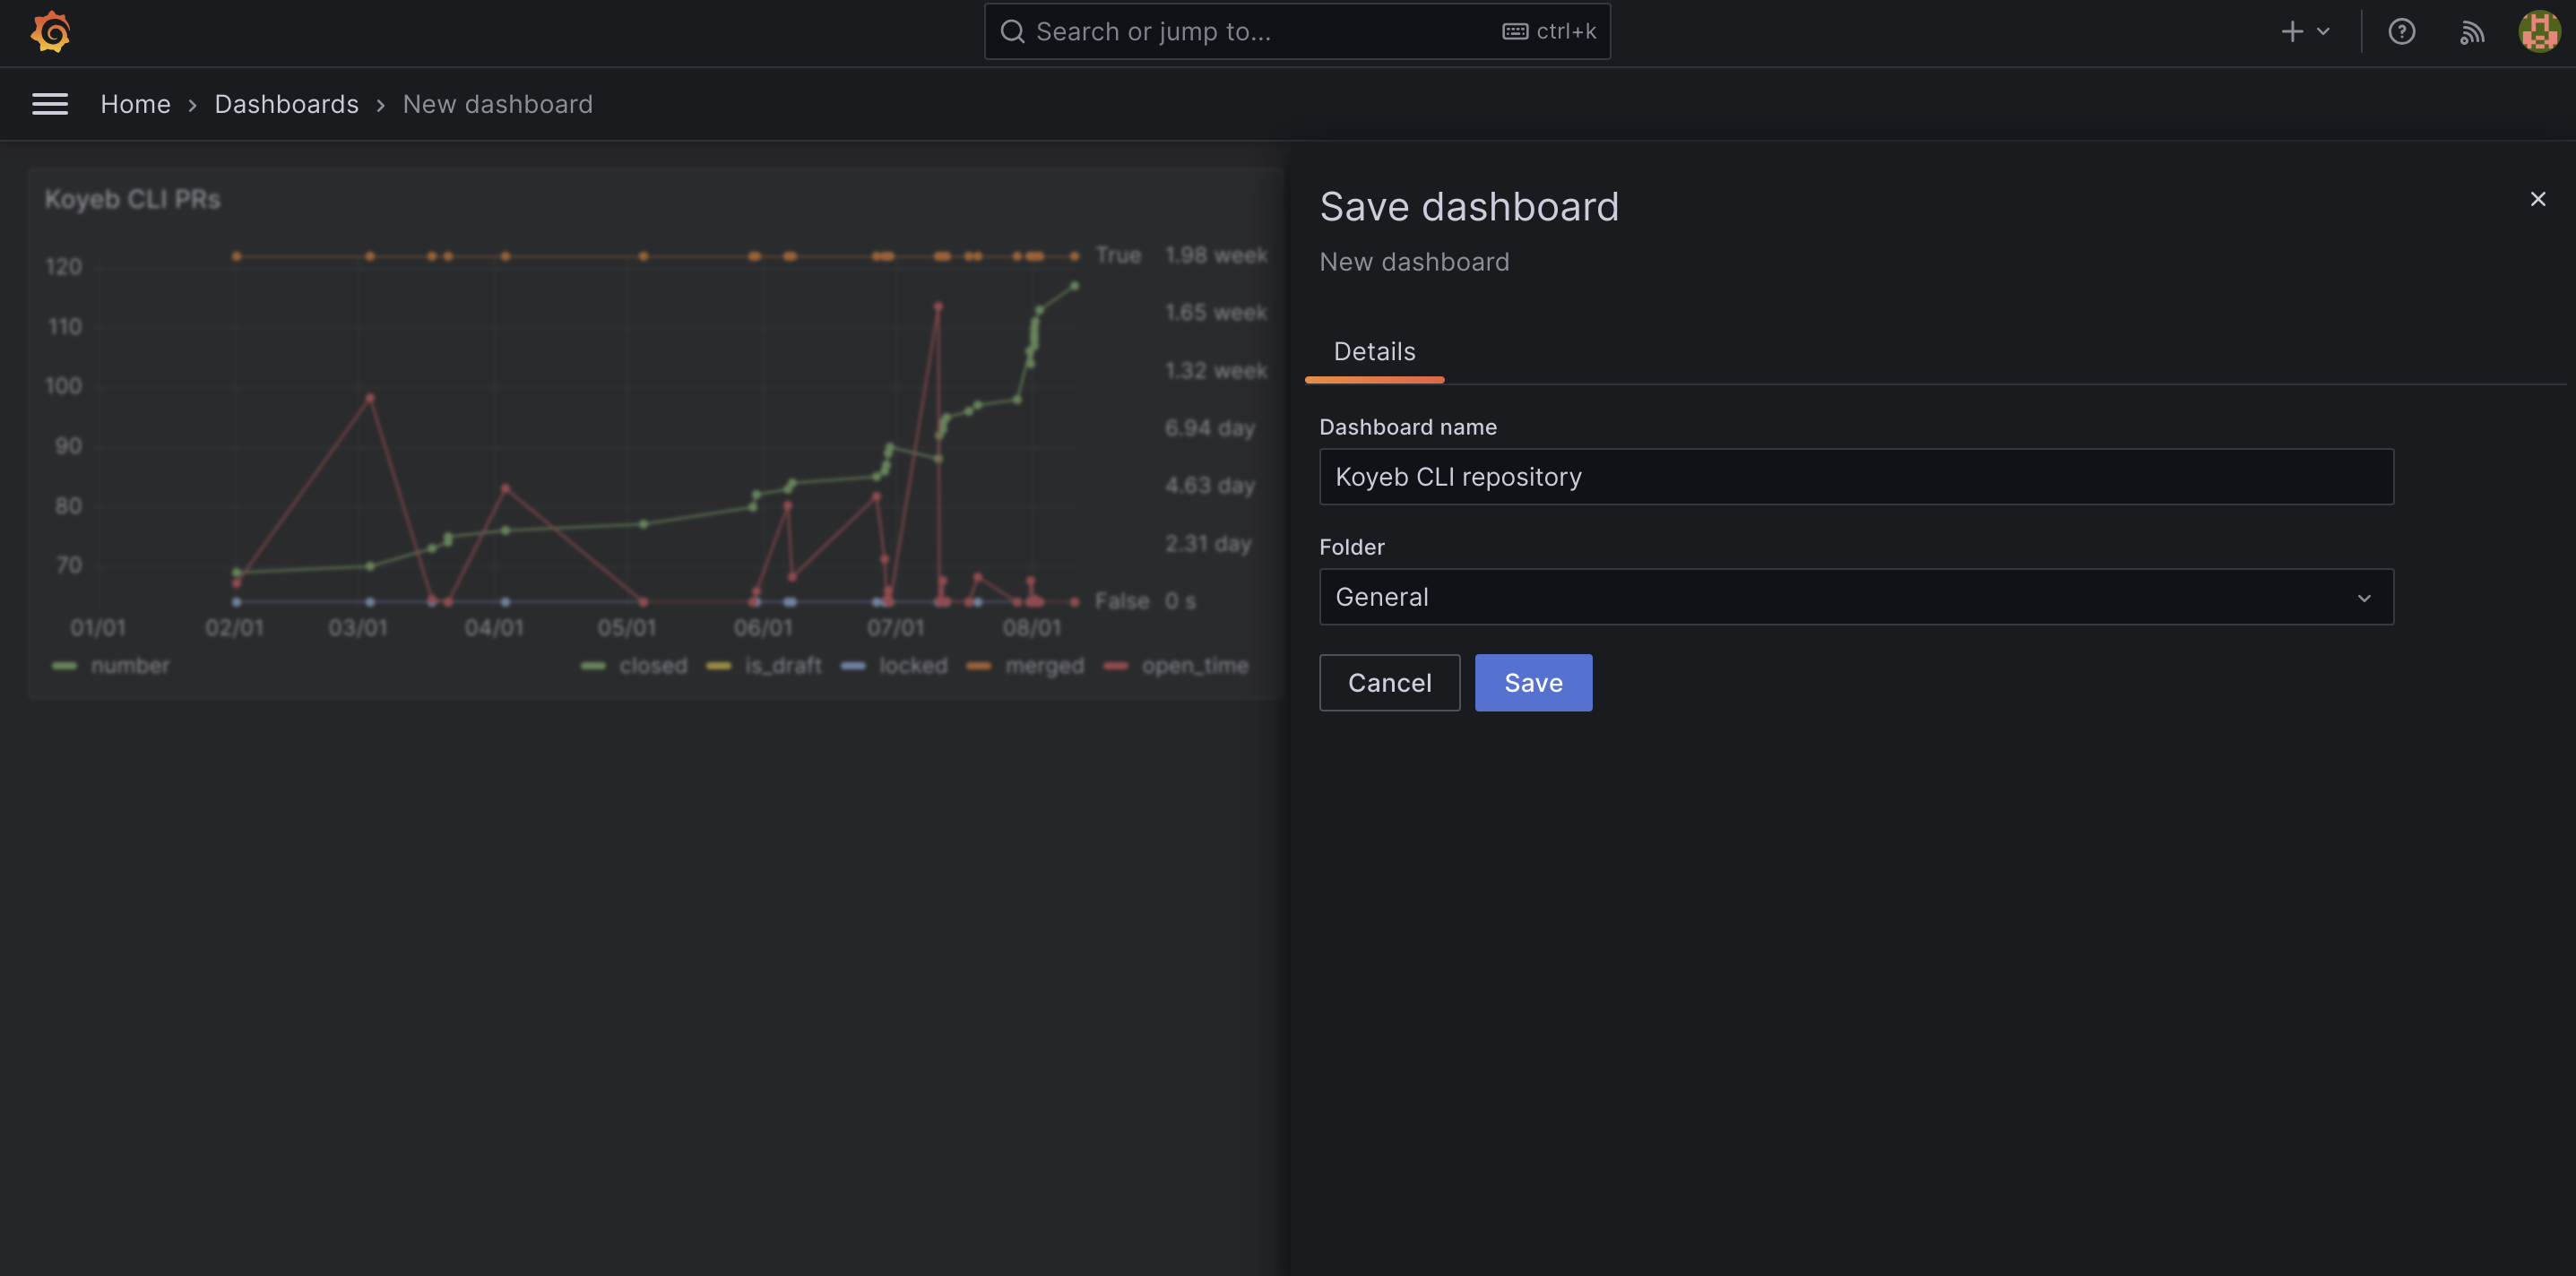
Click the save icon in the top row to name your new dashboard. Click the Save button when you're finished:
You've now connected your first data source and created a dashboard with some of the data it exposes. You can continue to visualize other data from the same repository, create dashboards for other GitHub data, and connect additional data sources.
Note: As you configure additional data sources, be sure to update the GF_INSTALL_PLUGINS environment variable to ensure that the plugins are automatically loaded on each deploy.
Conclusion
In this guide, we installed and configured the Grafana observability platform on Koyeb. We used an Aiven PostgreSQL database to store our data and deploy using Grafana's Docker images to allow for easy updating and scaling.
Grafana is a powerful tool that can help you track the data from many areas of your organization. Just as importantly, it exposes the data in an approachable way so that users can create their own dashboards and gain insight about the information that's most important to them. As your data management gains complexity, Grafana's architecture and Koyeb's high availability features make it simple to scale out by deploying to new regions or adding additional instances.