Inspect TLS encrypted traffic using mitmproxy and wireshark
| Nel mezzo del cammin di nostra vita mi ritrovai per una selva oscura, ché la diritta via era smarrita. | Midway upon the journey of our life I found myself within a forest dark, For the straightforward pathway had been lost. |
Divina Commedia, Inferno, Canto I
I had the chance to finally sit down and find a way to inspect TLS traffic flowing out of an application running on my machine. Although I did not invent anything, I needed to put together a lot of different tricks in order to succeed, and the documentation I could find online regarding this process is scattered, at best. So, here we are with a guide on “how to inspect TLS encrypted traffic without going nuts”. Hope you enjoy!
First act: The descent
The opportunity to learn how to inspect TLS encrypted traffic came out of the need to tweak Vector to use it to create the Koyeb log exporter. Since I had not yet mastered the whole codebase, I was not sure whether the code I added was producing the correct requests. Hooking into the code to show what it was sending was way too complicated. On the other end, the endpoint was a production system and I had no chance of verifying that the request was properly formatted.
With these limitations being clear, and with no possibility to downgrade the traffic to an unencrypted form anywhere, I realized my only option was to try to inspect the live stream of data, provided I could find a way to decipher it.
Let me set the stage for this show. I am on Arch Linux, but the following procedure will work on any distribution that includes systemd. It probably could also be ported to Docker containers, but I didn’t try. I will guide you through this journey using the following software (if you want to follow along, make sure to grab them with your favorite package manager):
- systemd-nspawn to manage containers
- mitmproxy to perform man-in-the-middle on the actual TLS stream
- wireshark to inspect the deciphered stream
- wireguard-tools to make the connection between the container and
mitmproxywork
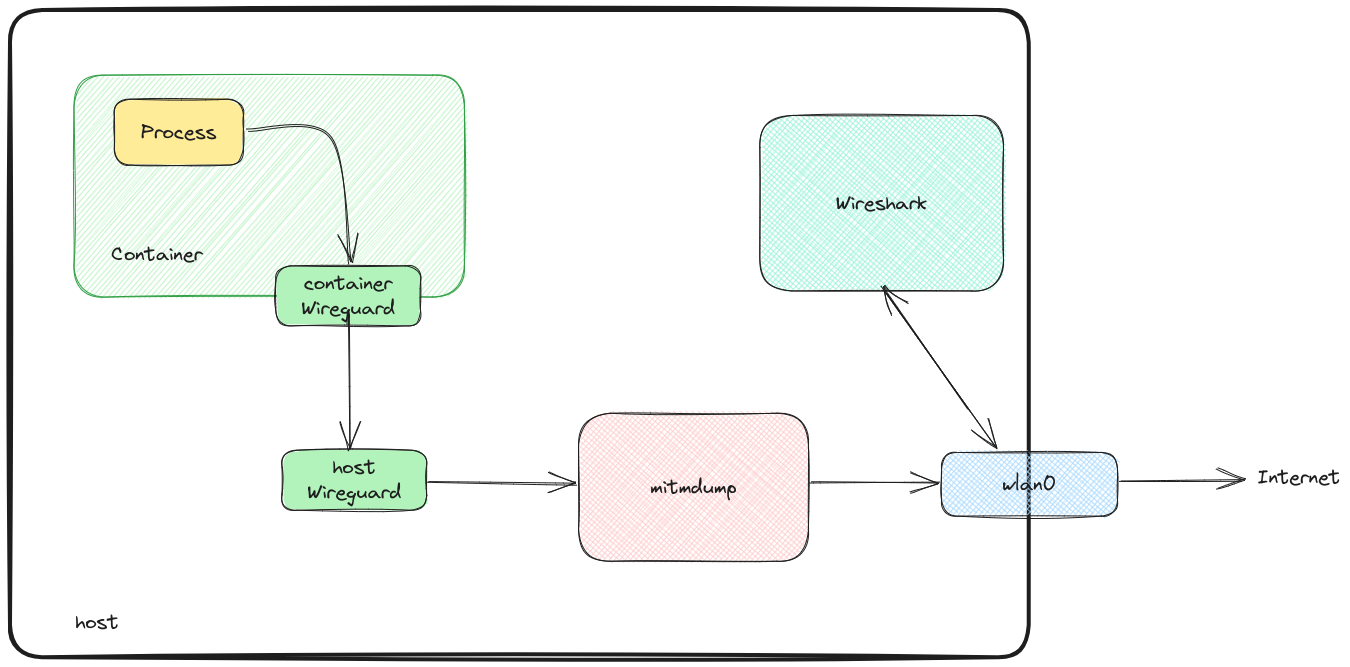
I will prepare a container to run the application. The container will route all the traffic to mitmdump (one of the programs of the mitmproxy suite) running on the host OS. The link between the container and mitmdump will use a wireguard tunnel. On the host, we will use wireshark to live-inspect and record the traffic of interest.
Second act: The struggle
As outlined above, I will run the software whose traffic I want to inspect in a container. This is not a usual Docker container, but rather a systemd-nspawn managed container (after all, containers are an abstraction that rely on some Linux kernel features). The reason for this is twofold:
- Because the application I want to debug does not natively allow delegating the proxying AND encryption of its traffic to a third party, we need it to not be aware that it’s being proxied (we need to perform a MitM attack, in some sense). This requires the proxy to be transparent, making the network transport less straightforward than just running the application on the host.
- To successfully conduct a MitM attack without relying on vulnerabilities in the network+transport stack (that we always hope do not exist), we need to add a CA to the system’s trusted CAs. This is less than ideal (meddling with the system trust store is something I don’t feel easy about). For this scope, I use a feature of
systemd-nspawnthat creates an ephemeral container using my whole OS host as a blueprint.
Let me cut this short and go directly to the command line I used. I ran this from the root of the source code of the project I am working on:
sudo systemd-nspawn \
--boot \
--ephemeral \
--hostname=virgil \
--machine=virgil \
--network-veth \
--bind-ro=$PWD:/workdir \
--directory /
This instruct systemd-nspawn to start (--boot) an ephemeral (--ephemeral) container, with hostname (--hostname) and named as (--machine) virgil. It creates a virtual ethernet interface between the container and the host (--network-veth), mounting the current directory to /workdir (--bind-ro=$PWD:/workdir), using my root directory as blueprint (--directory /). This last bit is zero cost on my system because I use btrfs as filesystem for my root partition with CoW enabled. Booting the container like this is a zero-cost operation.
After this, from inside the container, I take notice of the IP of the gateway with:
ip route|grep default
This information will be used in the next step to properly configure the transparent proxying. My current value is 192.168.184.145.
Now, back on the host OS, I start mitmdump to start the intercepting side:
SSLKEYLOGFILE="$HOME/.mitmproxy/sslkeylogfile.txt" \
    mitmdump --mode wireguard@192.168.184.145:12345
SSLKEYLOGFILE instructs mitmdump to save the TLS session key in a file at the specified path. This will be needed by wireshark to live-inspect the (otherwise encrypted) TLS traffic. I am starting the program specifying it to use the wireguard mode (--mode wireguard@192.168.184.145:12345), binding to the IP I retrieved before (the one used as the default gateway by the container).
mitmdump outputs something like the following:
[15:55:08.494] WireGuard server listening at 192.168.184.145:12345.
------------------------------------------------------------
[Interface]
PrivateKey = aFXQvmS1avL+n5zxSoN2a5VAS98+j3yGQp1V8H7Tt2U=
Address = 10.0.0.1/32
DNS = 10.0.0.53

[Peer]
PublicKey = 1dtIcVOQmjdaTboceokPMMSXTRcDIn70LAXb+fieOU8=
AllowedIPs = 0.0.0.0/0
Endpoint = 192.168.1.134:51280
------------------------------------------------------------
The lines between the dashes are an (almost) valid configuration for the container to connect to mitmdump via wireguard. I wrote almost because there is a bug (or is it a feature?) in the mitmproxy code that prevents it from outputting this configuration with the address specified in the command line. Instead, it always uses the address of the internet-facing interface (192.168.1.134, in this case). This has to be replaced with the address specified above:
[Interface]
PrivateKey = aFXQvmS1avL+n5zxSoN2a5VAS98+j3yGQp1V8H7Tt2U=
Address = 10.0.0.1/32
DNS = 10.0.0.53

[Peer]
PublicKey = 1dtIcVOQmjdaTboceokPMMSXTRcDIn70LAXb+fieOU8=
AllowedIPs = 0.0.0.0/0
Endpoint = 192.168.184.145:12345
I put this content in a file at /root/mitm.conf inside the container. I also copy the mitmdump CA that is used to perform the MITM attack from the host (located at ~/.mitmproxy/mitmproxy-ca-cert.pem) to the container (in /root/mitm-ca.pem). Now, I have to add it to the trust store of the container:
trust anchor --store /root/mitm-ca.pem
Then, connect to mitmdump, again from inside the container:
wg-quick up /root/mitm.conf
Now we are ready to decrypt the TLS encrypted traffic.
Third act: The treasure
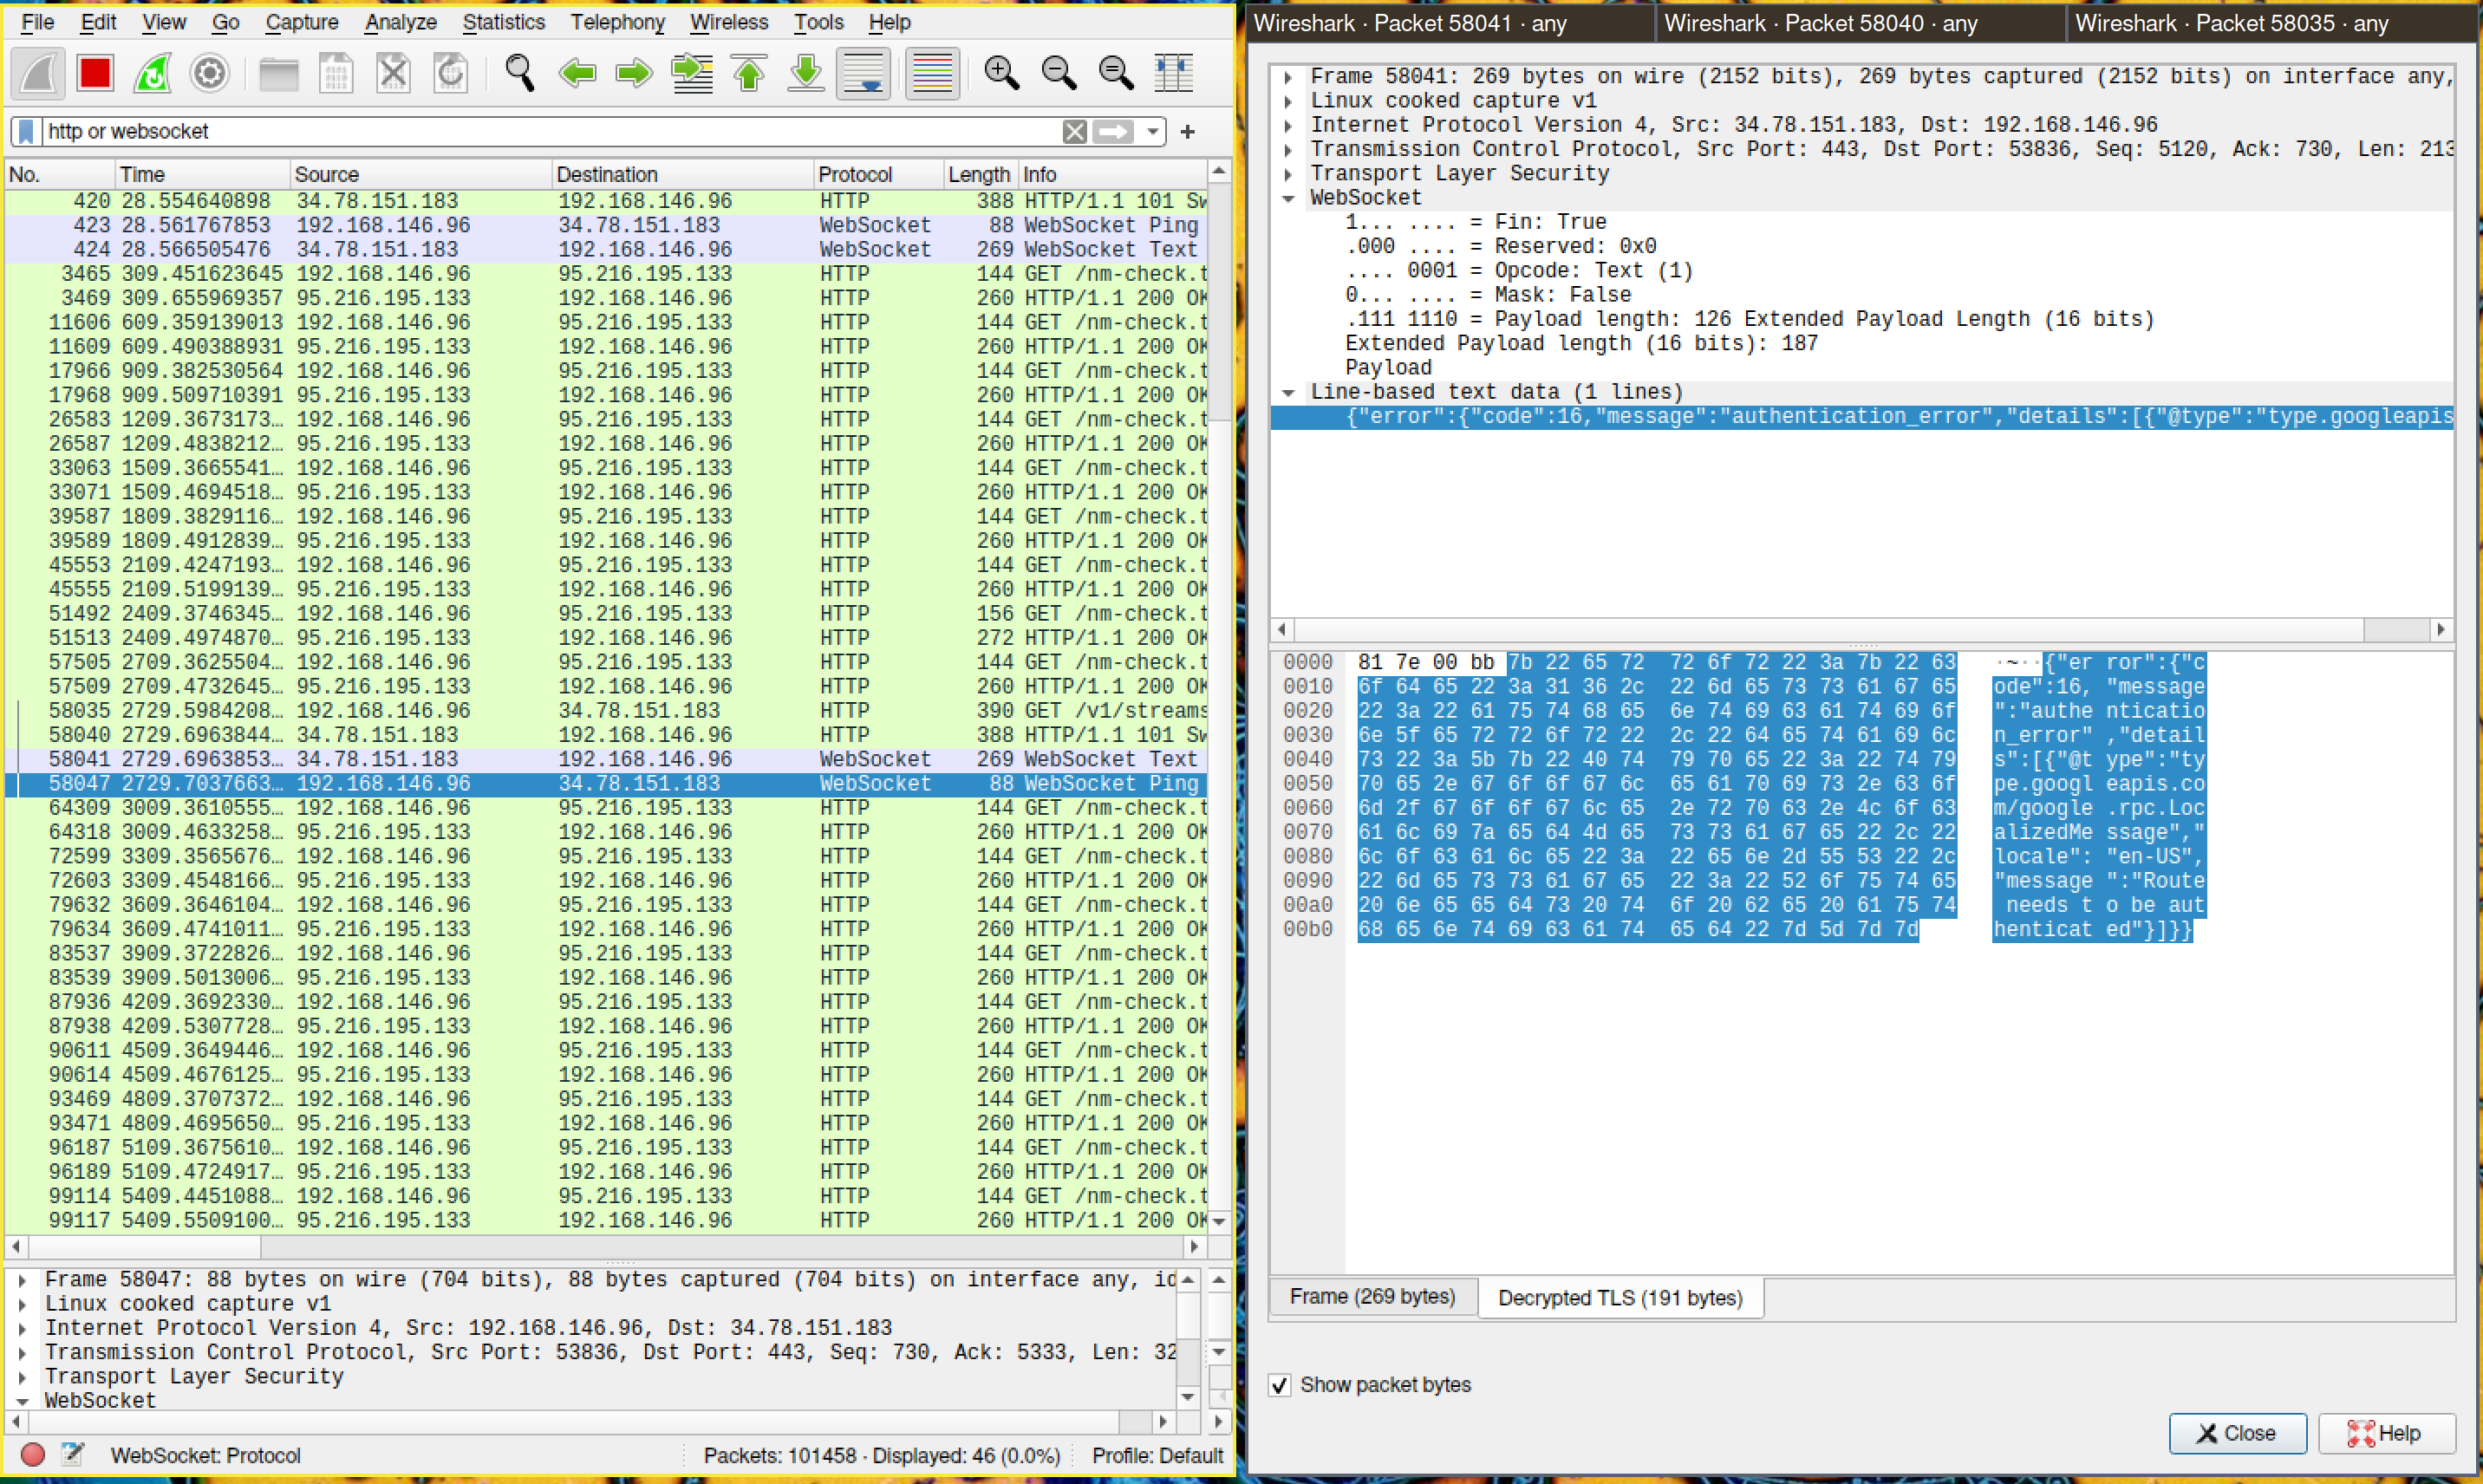
I now have all the pieces in place to start inspecting the traffic with wireshark. Back on the host, start wireshark. To tell it how to decrypt the TLS encrypted traffic, just go to Edit -> Preferences -> Protocols -> TLS -> (Pre)-Master-Secret log filename and input the path specified in the SSLKEYLOGFILE environment variable above.
Let’s instruct wireshark to listen to the traffic on the host OS public interface (the one where the default route is. For example the wireless interface if you are connected through WiFi). Note that both mitmdump and wireshark listen to the same traffic, but while the former alters it to perform the MitM, the latter just displays it.
We can now follow the decrypted streams!
Parting words
It was challenging, but now I am able to live-inspect the traffic and validate the changes I make to the code in real time!
This is really useful in cases like the one I faced, where I could not be sure that the requests I was sending were properly formatted. Although the setup is admittedly not straightforward, I hope this information is useful to you should you ever embark on your own journey to inferno inspect TLS encrypted traffic.
If you’d like to reach out about this article, write to us on the Koyeb Community.
Want to see the log exporter in action? Deploy your full stack apps and APIs on the platform, read the log exporter doc, and start exporting your build and runtime logs today!
References
- https://wiki.archlinux.org/title/btrfs#Mounting_subvolume_as_root
- https://wiki.archlinux.org/title/systemd-nspawn
- https://wiki.archlinux.org/title/WireGuard
- https://docs.mitmproxy.org/stable/concepts-modes/#wireguard-transparent-proxy
- https://docs.mitmproxy.org/stable/howto-wireshark-tls/
- https://docs.mitmproxy.org/stable/concepts-certificates/
- https://wiki.archlinux.org/title/User:Grawity/Addinga_trusted_CA_certificate#System-wide–Arch,_Fedora(p11-kit)