From Envoy to Consul: Chasing a Latency Spike Across a Globally Distributed Stack
At Koyeb, we run a serverless platform for deploying production-grade applications on high-performance infrastructure—GPUs, CPUs, and accelerators. You push code or containers; we handle everything from build to global deployment, running workloads in secure, lightweight virtual machines on bare-metal servers around the world.
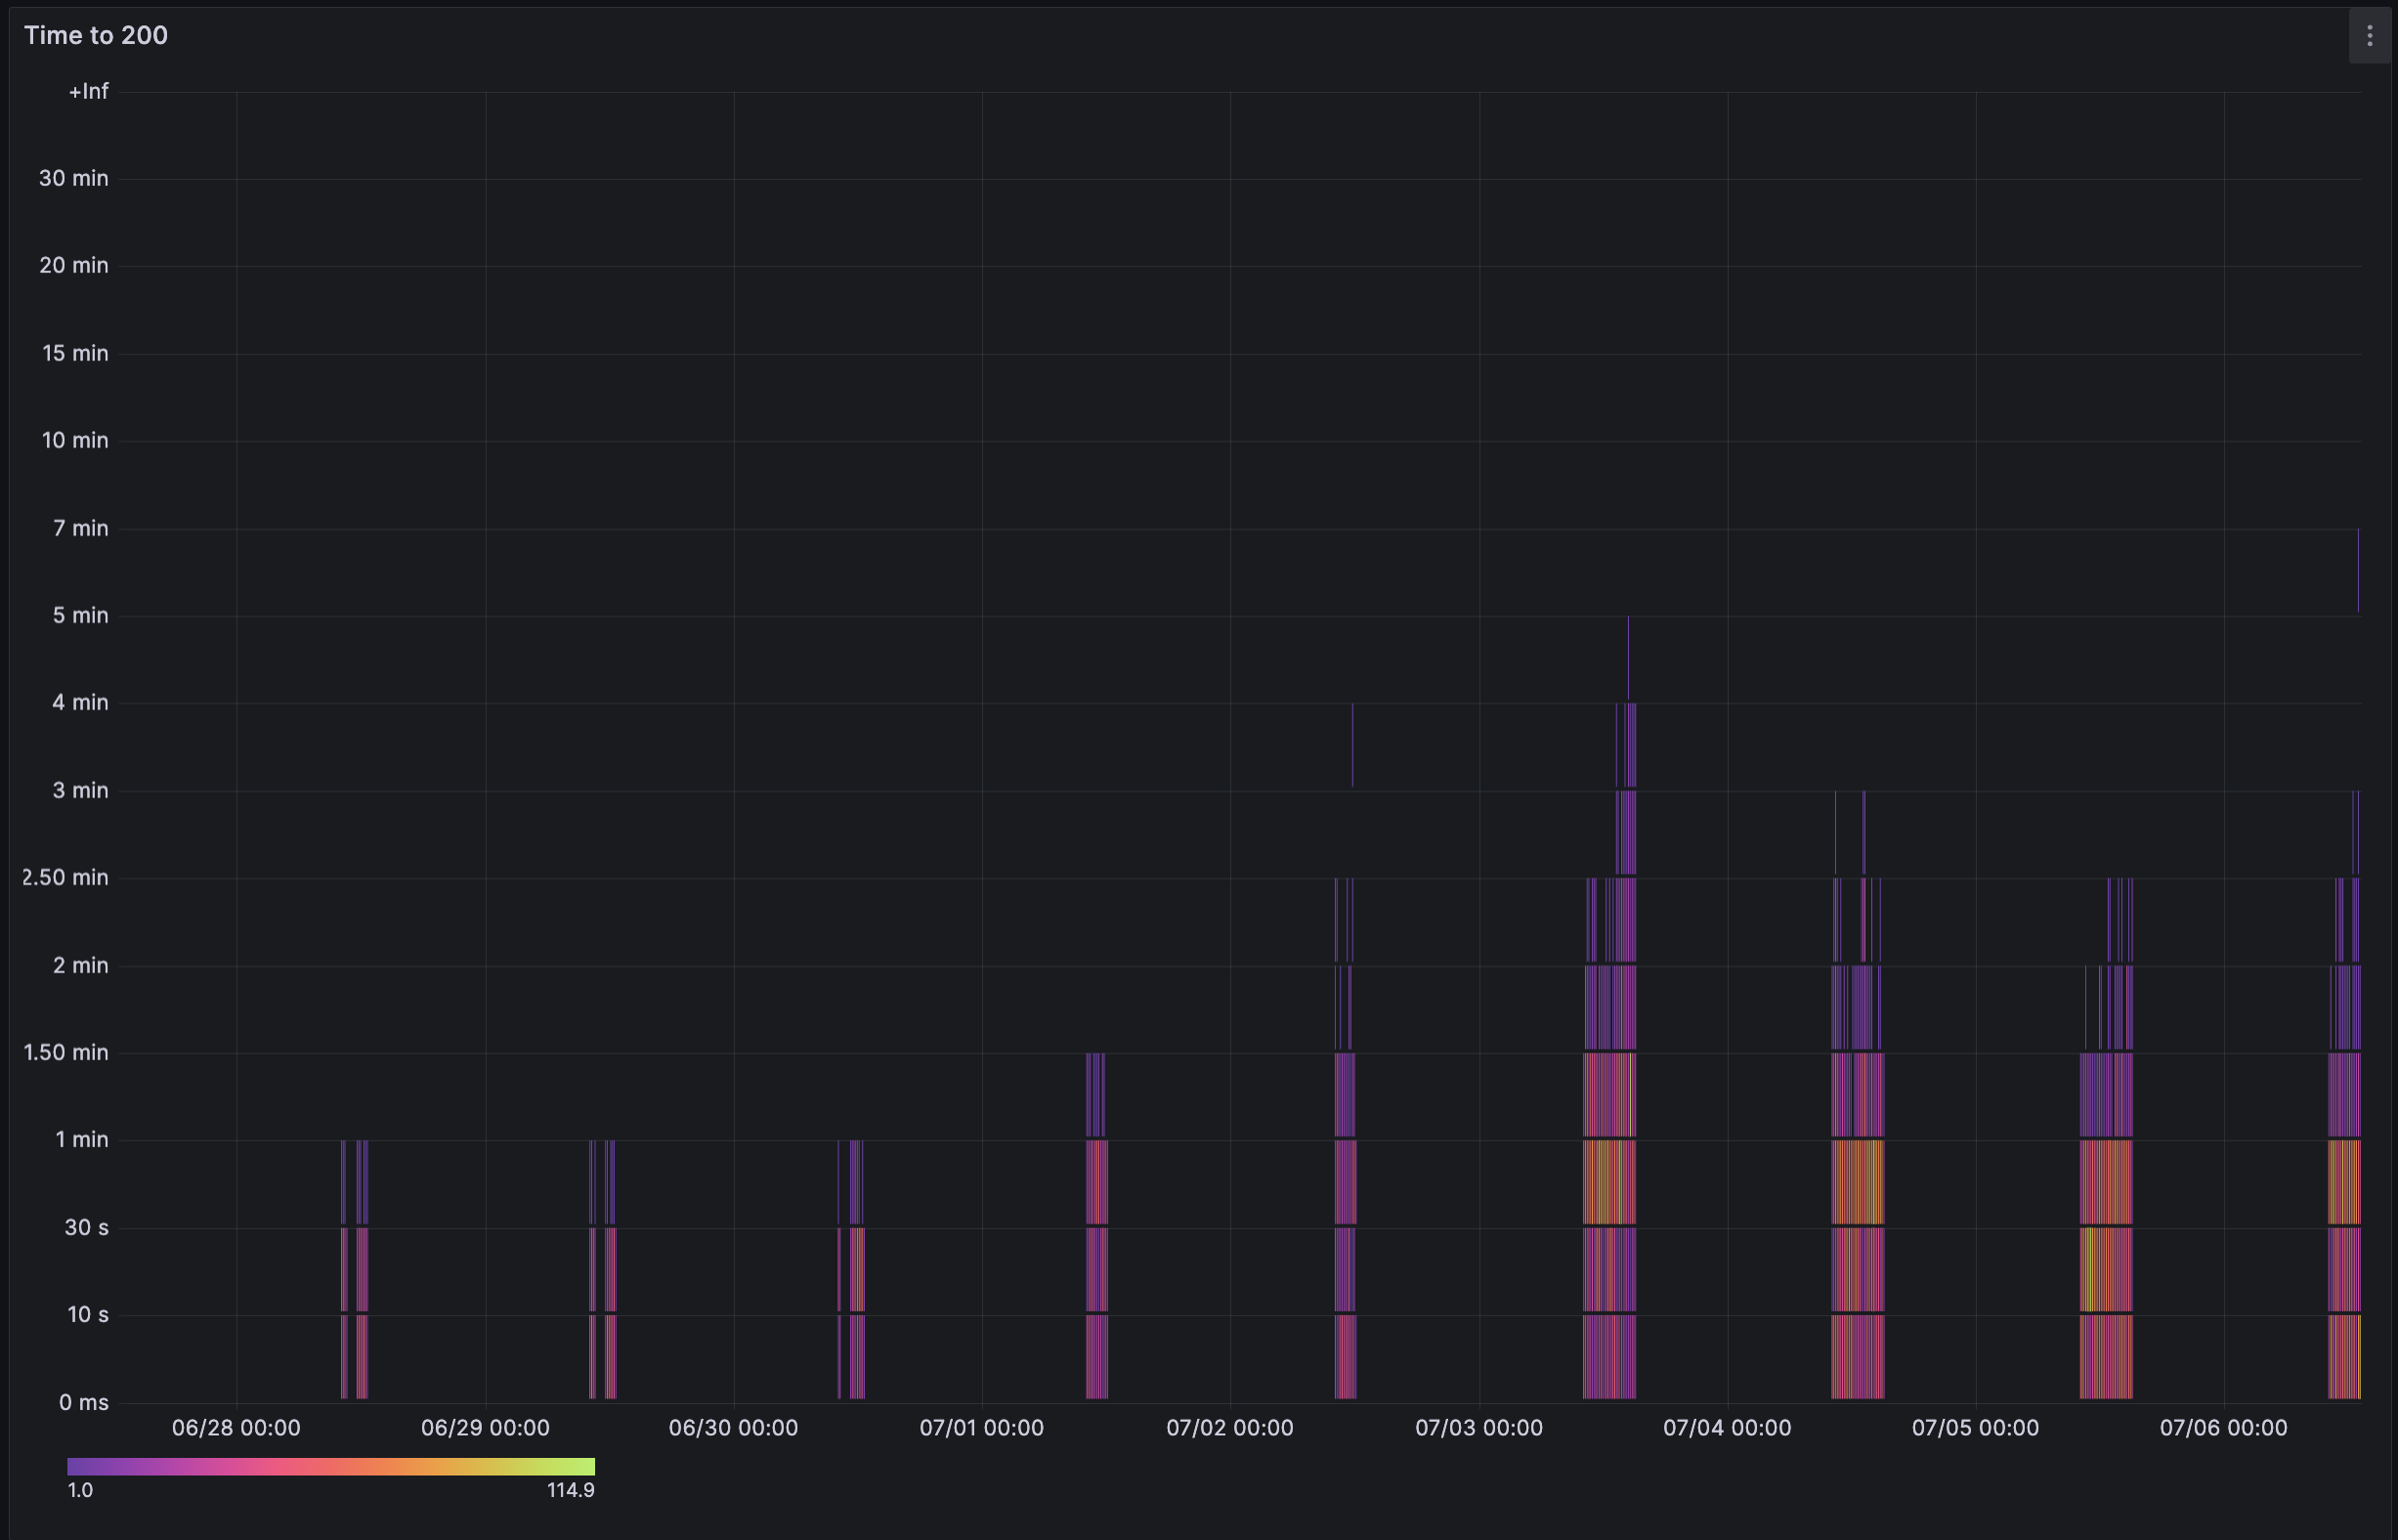
One of the core metrics we track is time to HTTP 200: the time between a successful deployment (excluding build) and the moment the app is ready to accept traffic. This time typically stays under 30 seconds, but lately we’ve seen it spike to several minutes!
This post is about how a latency issue led us to investigate across the stack — from Envoy to Consul’s caching behavior.
The Usual Suspect: Envoy
We operate our own global load balancing stack. This means that when a user deploys an app on Koyeb—in one or multiple regions—it’s our responsibility to route traffic along the shortest path to the closest app, based on the user’s location, to minimize latency.
Our load balancing layer is built on Envoy, a highly configurable TCP/HTTP proxy. We run code that generates precise routing rules and continuously delivers them to Envoy instances distributed around the world.
Each Envoy needs to be explicitly told how to handle inbound traffic, so when a new app is spun up on Koyeb, all global load balancers must be updated, or the app simply won’t be reachable.
Envoy configuration propagation is our go-to suspect when time to HTTP200 increases.
To ensure all load balancers are synchronized, we have an internal service (called knetwork) that runs on repeat to generate and deliver Envoy configurations.
This code path is critical, if it slows down or breaks, there’s an immediate impact: newly deployed services may be delayed or not reachable online at all.
And sure enough, our metrics showed knetwork was taking significantly longer to generate Envoy configs.
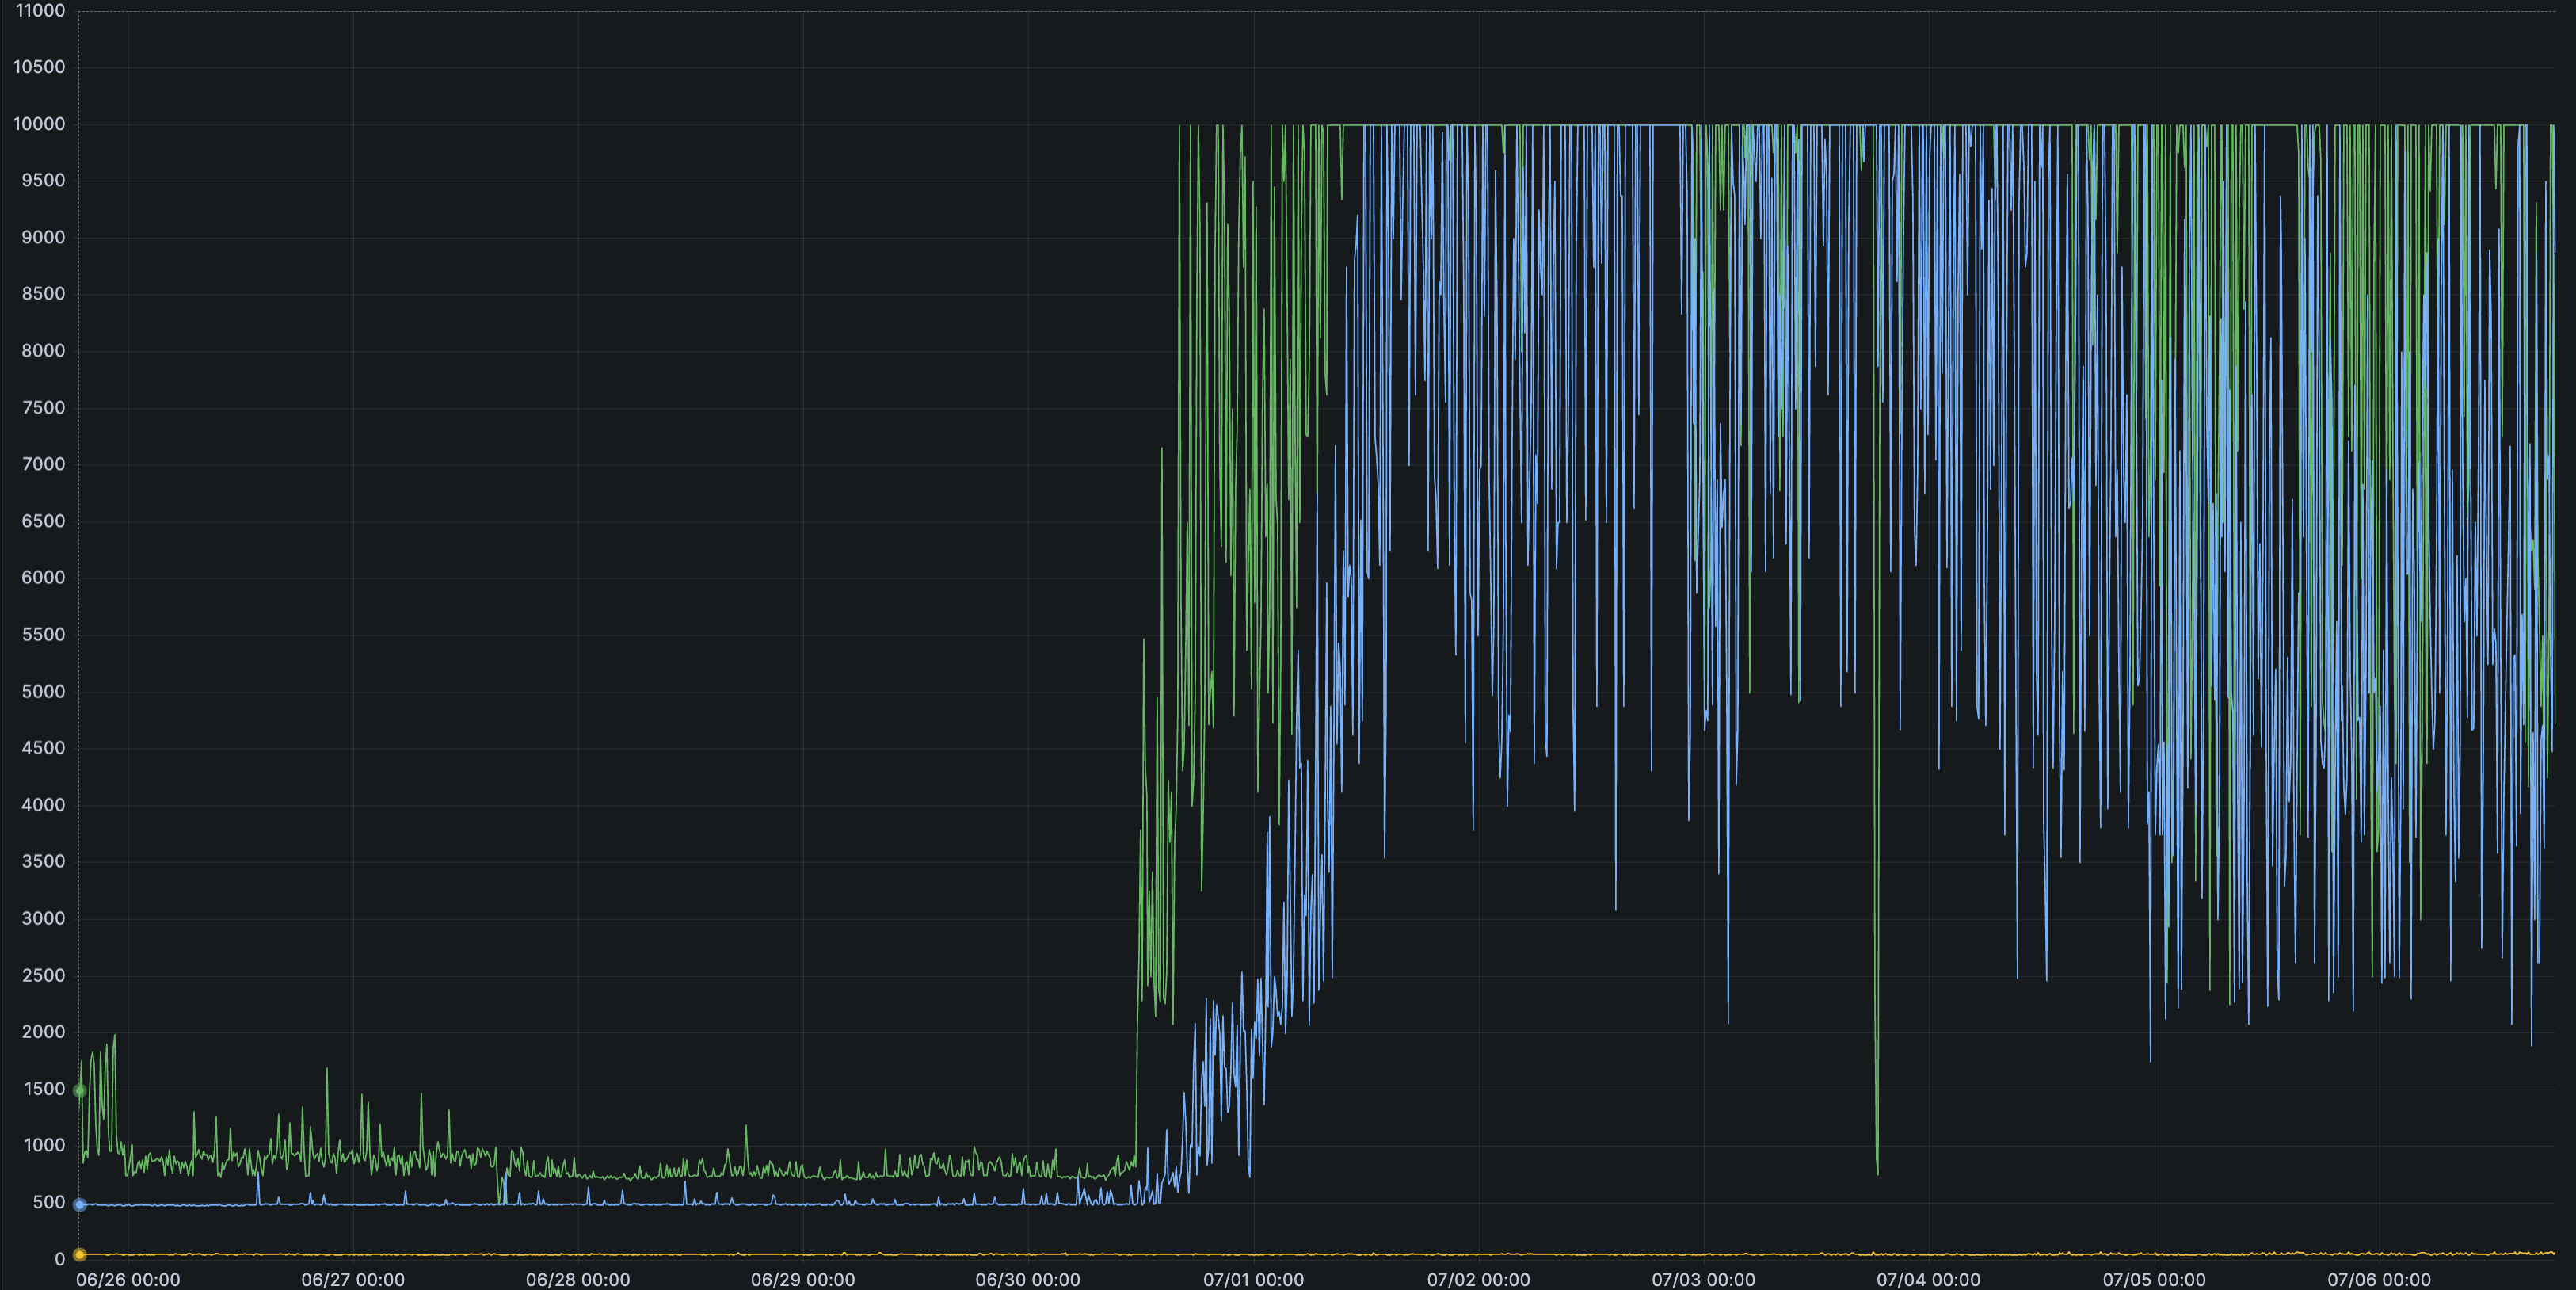
This graph shows that generating load balancer configurations started taking significantly more time at a certain point. For our users, this meant apps took much longer to go live—sometimes up to a few minutes instead of the usual 30 seconds.
We hadn’t made any code changes in this service, so we were wondering why we'd see such a sudden degradation.
Unusual Latency from Consul
We have different kinds of Envoy load balancers:
- Global load balancers: Maintain an aggregated view of all Koyeb apps and route inbound traffic to the nearest regional HTTP load balancer where the user’s application is running
- Regional HTTP load balancers: Maintain a regional, more precise, view of all Koyeb apps in specific regions. Direct incoming requests to the compute instance where the user’s app is running
Digging deeper in our observability tools, we noticed the increased latency came from generating the configuration for our regional HTTP load balancers.
As mentioned earlier, to generate and continuously synchronize our load balancers, we have an internal service called knetwork.
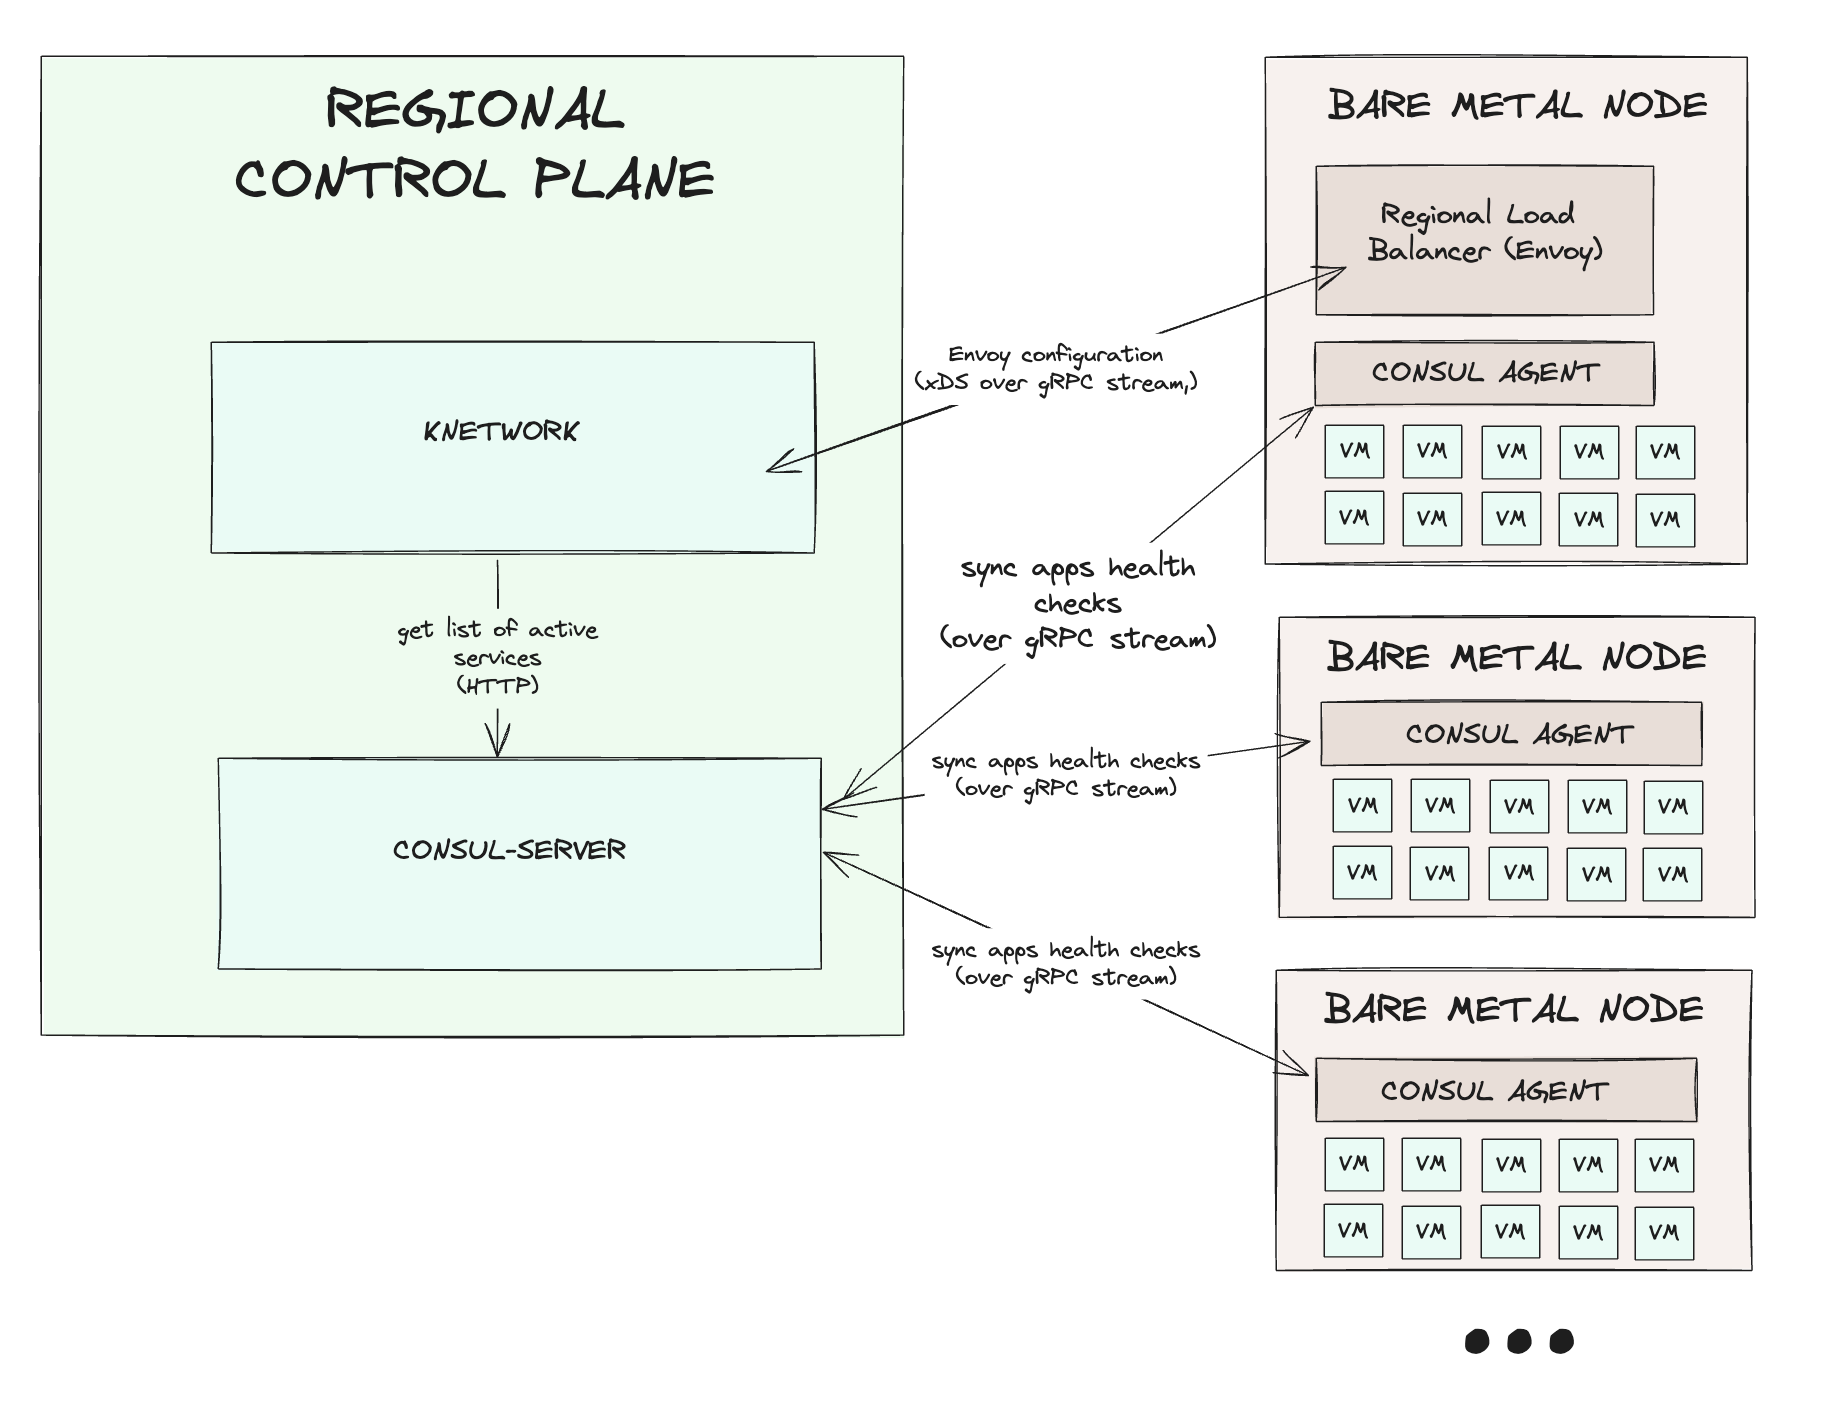
In each region, Koyeb apps register themselves with a dedicated Consul server. knetwork then queries Consul to retrieve a list of all Koyeb apps and their metadata.
Below is a high-level schema of how Regional HTTP Load Balancers work:
We noticed that latency from knetwork to Consul servers had increased significantly. But there was no clear reason for Consul to suddenly struggle! The volume of data hadn’t changed, and our usage patterns were the same.
While investigating, we spotted that Consul had leadership issues—or more exactly, Consul pods were struggling to talk to each other:
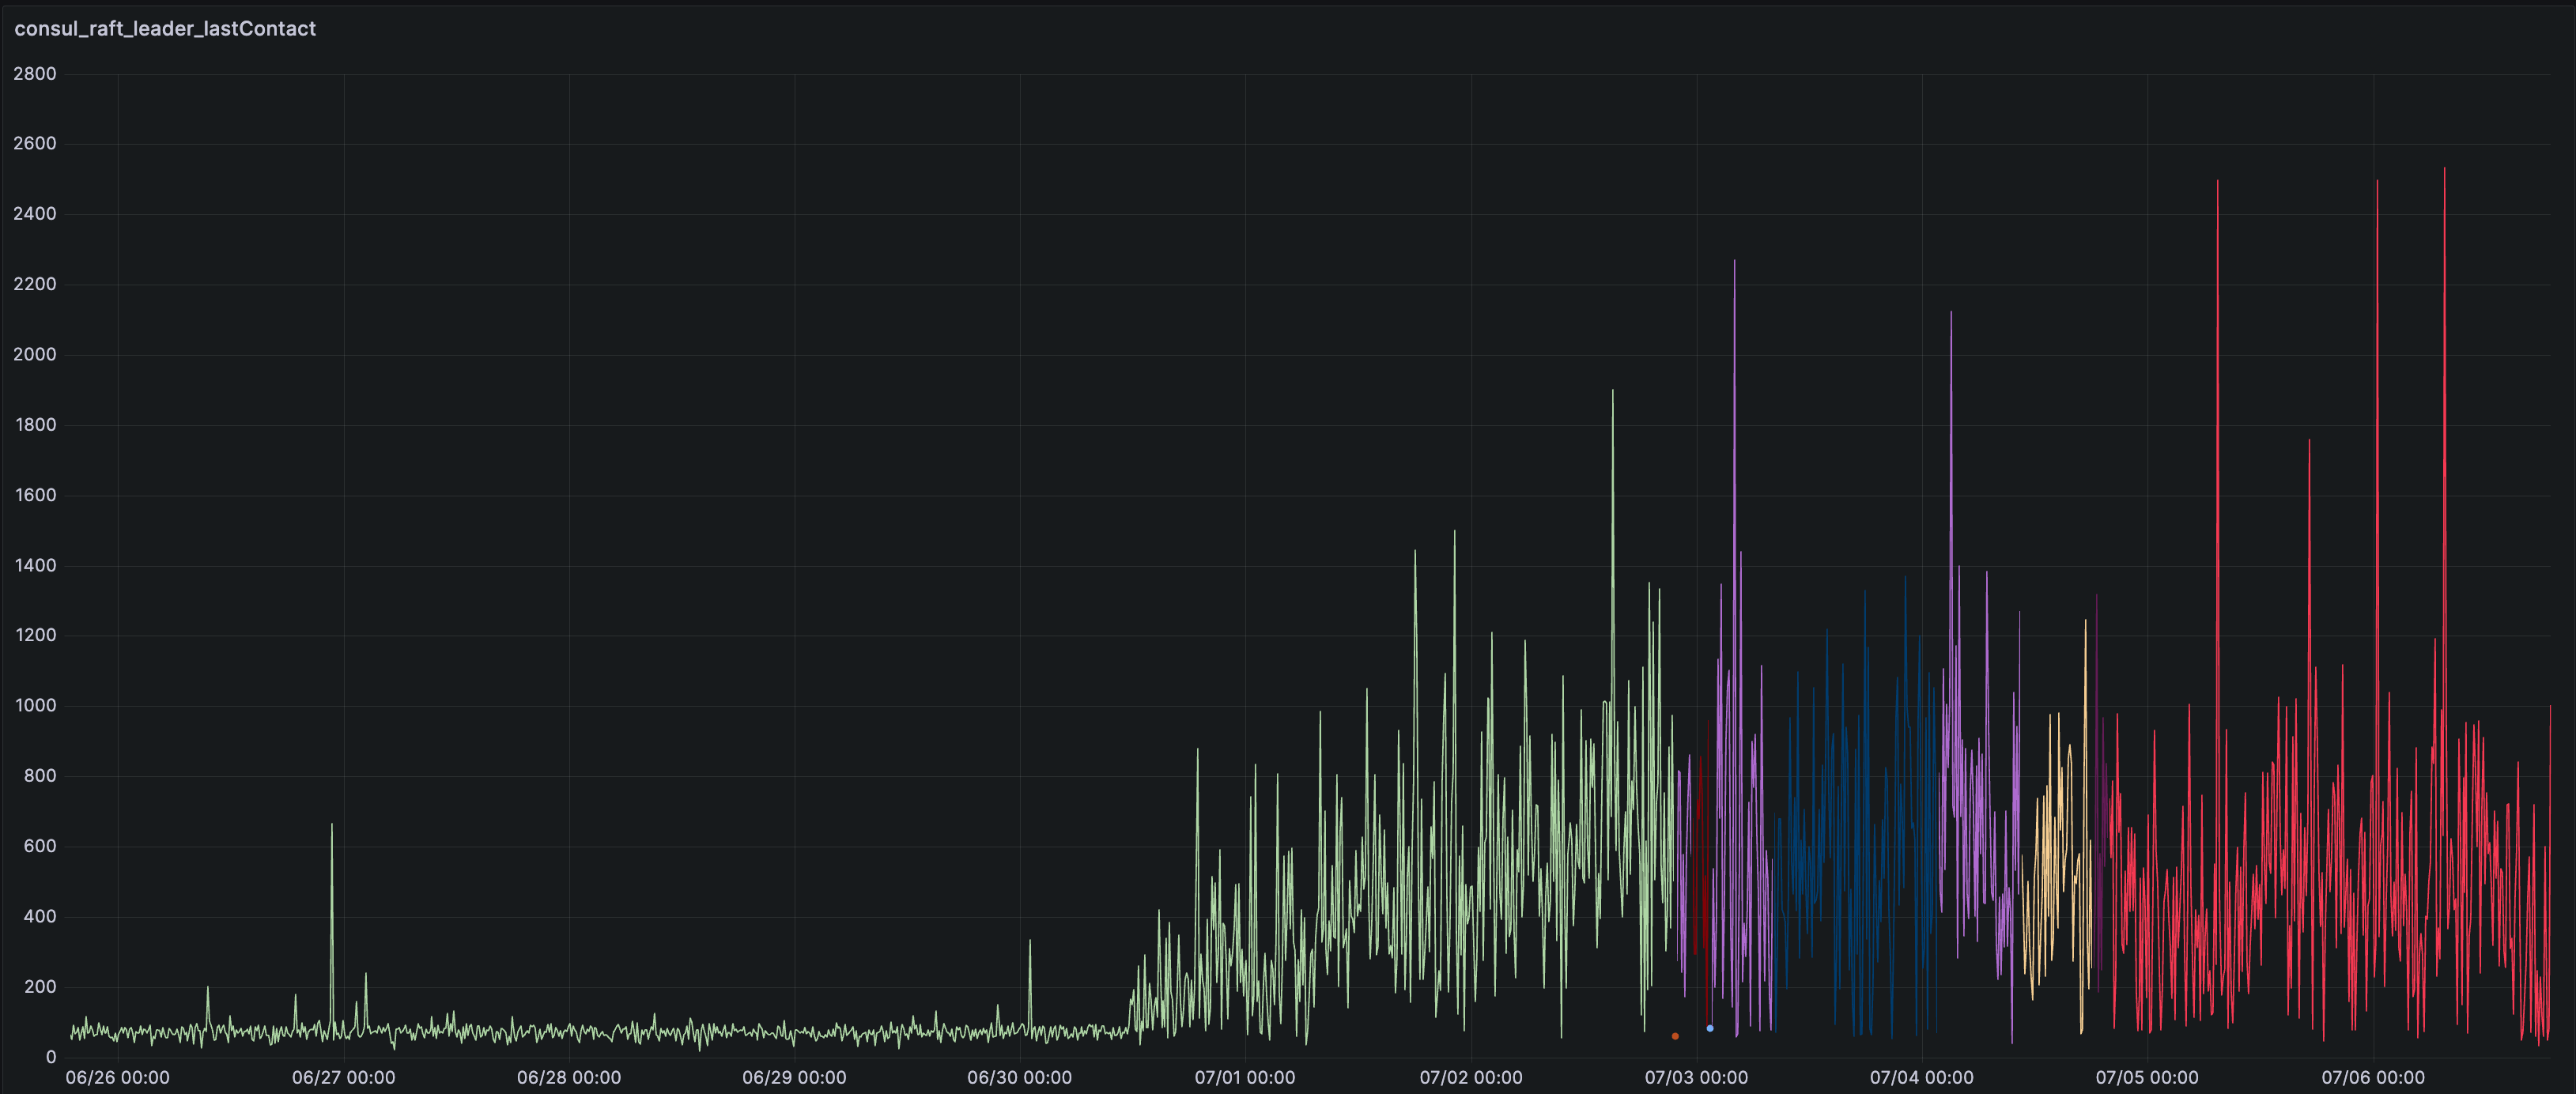
Nothing in the logs stood out. The only visible consequence was that Consul started burning a lot of CPU and struggled to keep up with its basic tasks.
This was affecting both Consul’s Raft routines and its ability to respond to knetwork’s queries to retrieve the data needed to generate load balancer configurations.
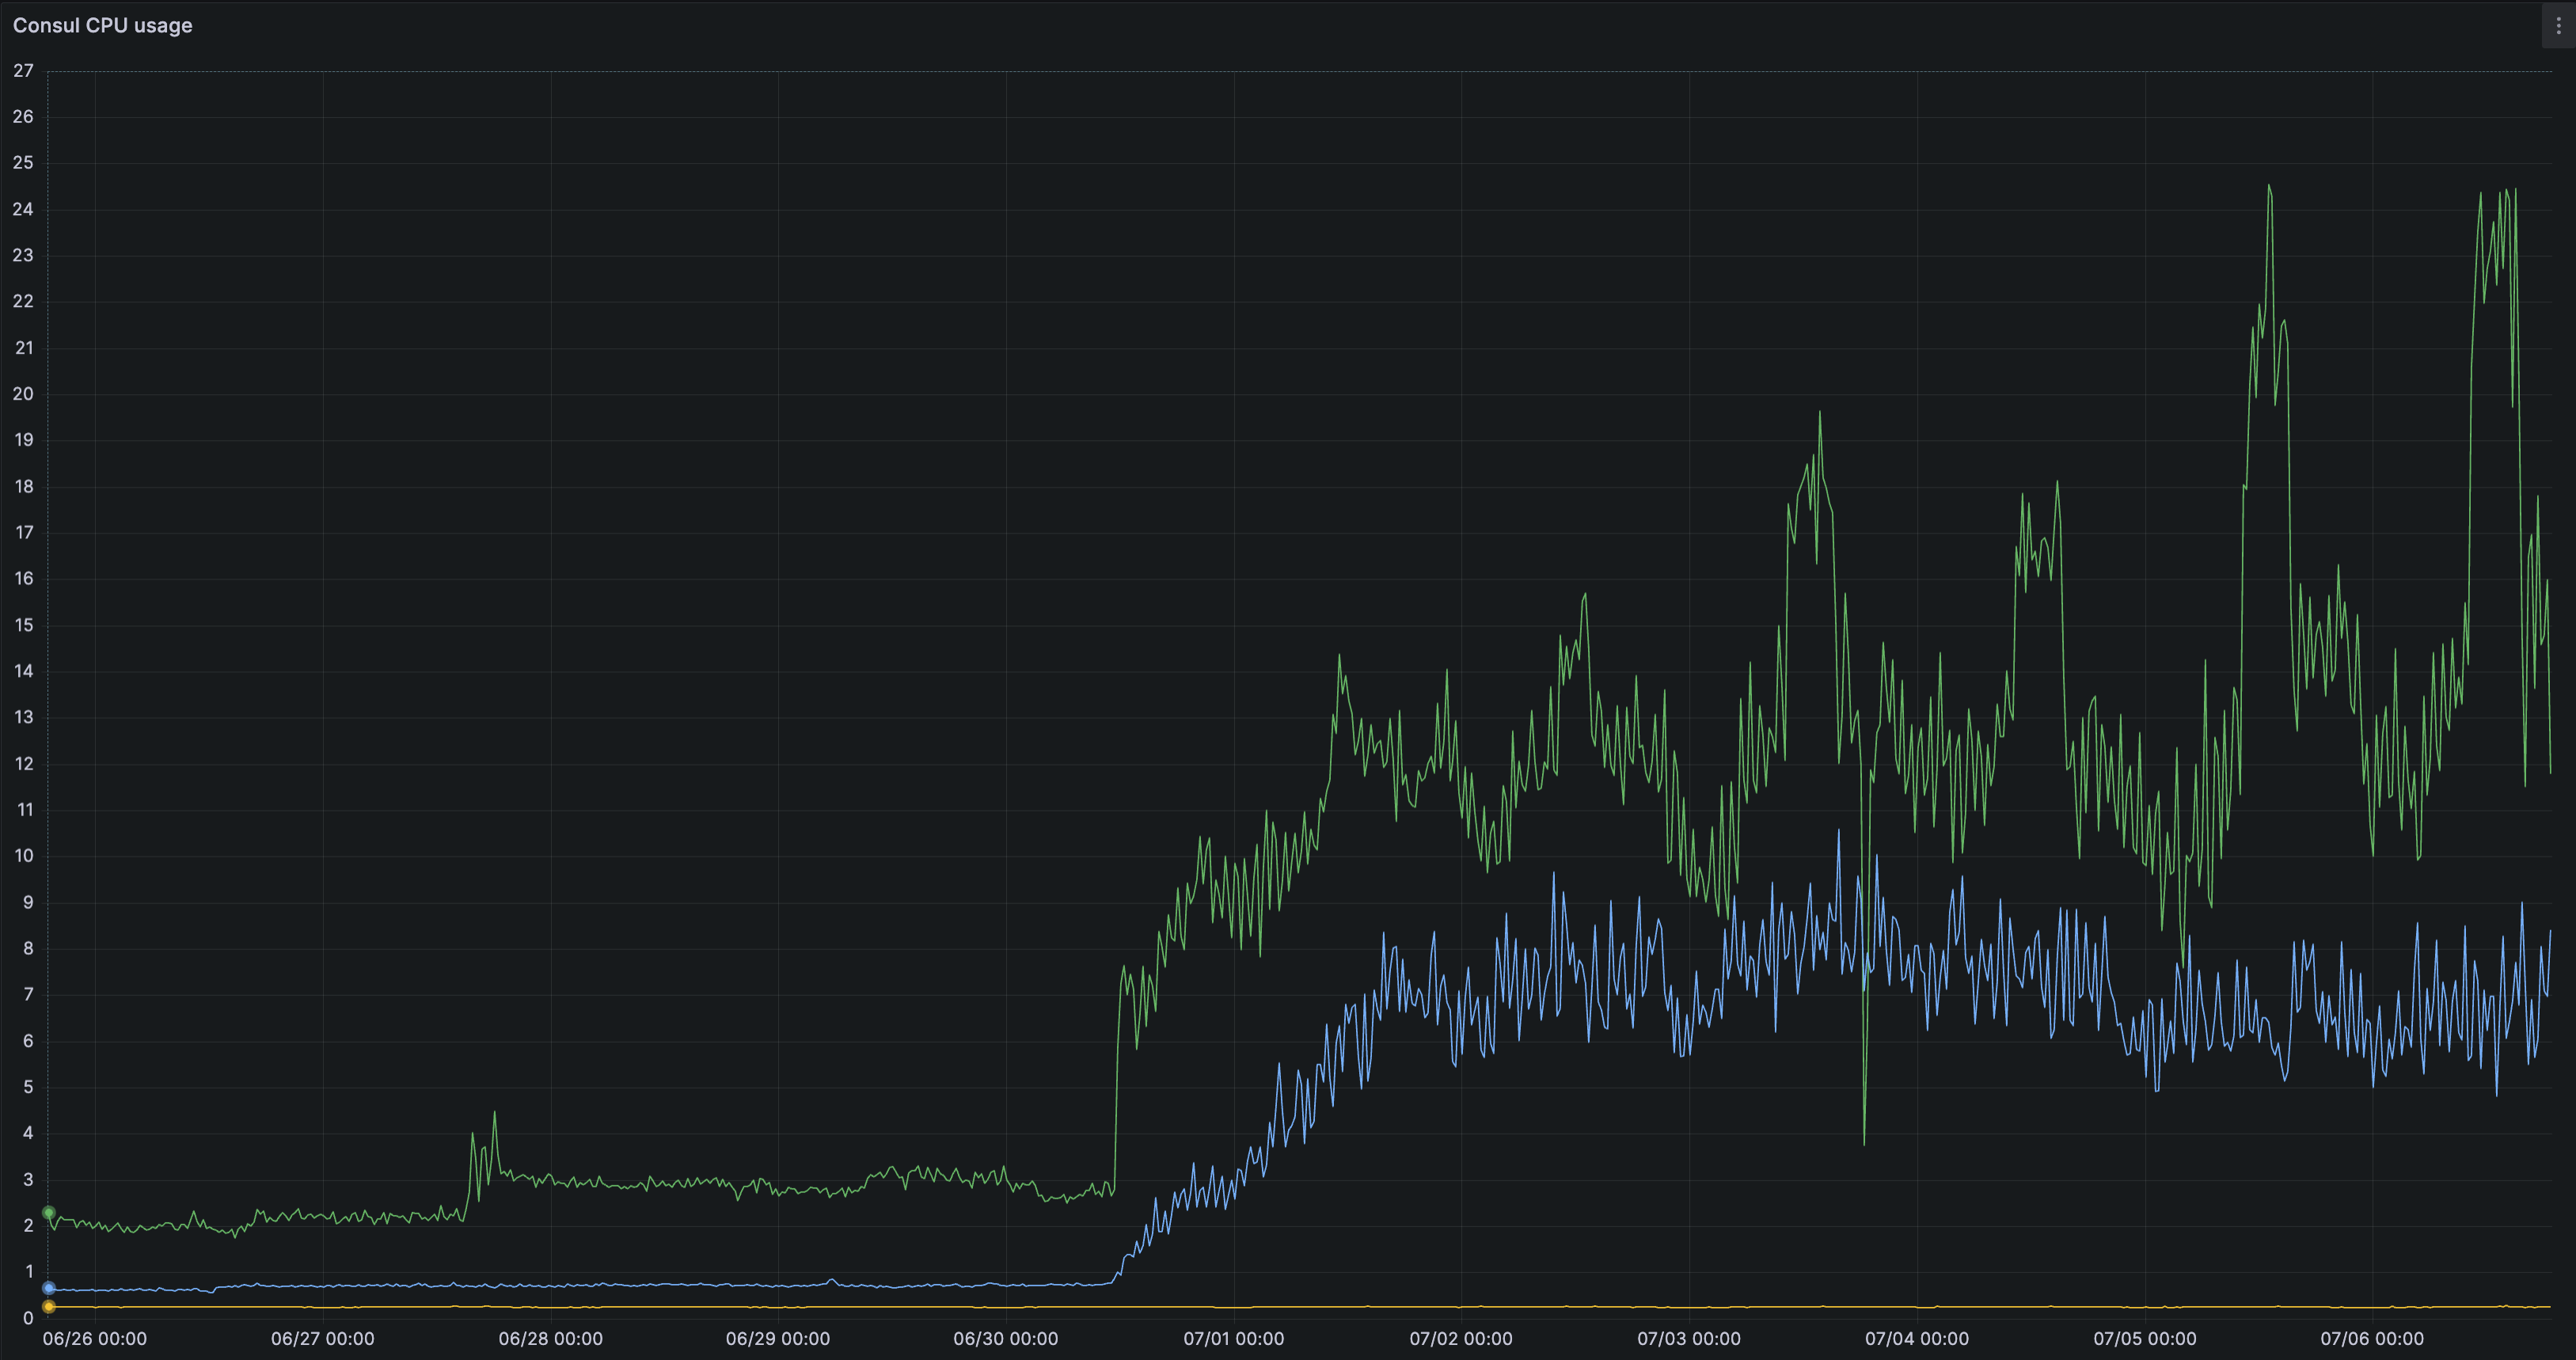
To bring “time to HTTP 200” back within our tolerance range, we quickly mitigated the issue by giving more CPU to our Consul cluster, which stabilized things while we continued investigating what was going on.
Profiling with pprof
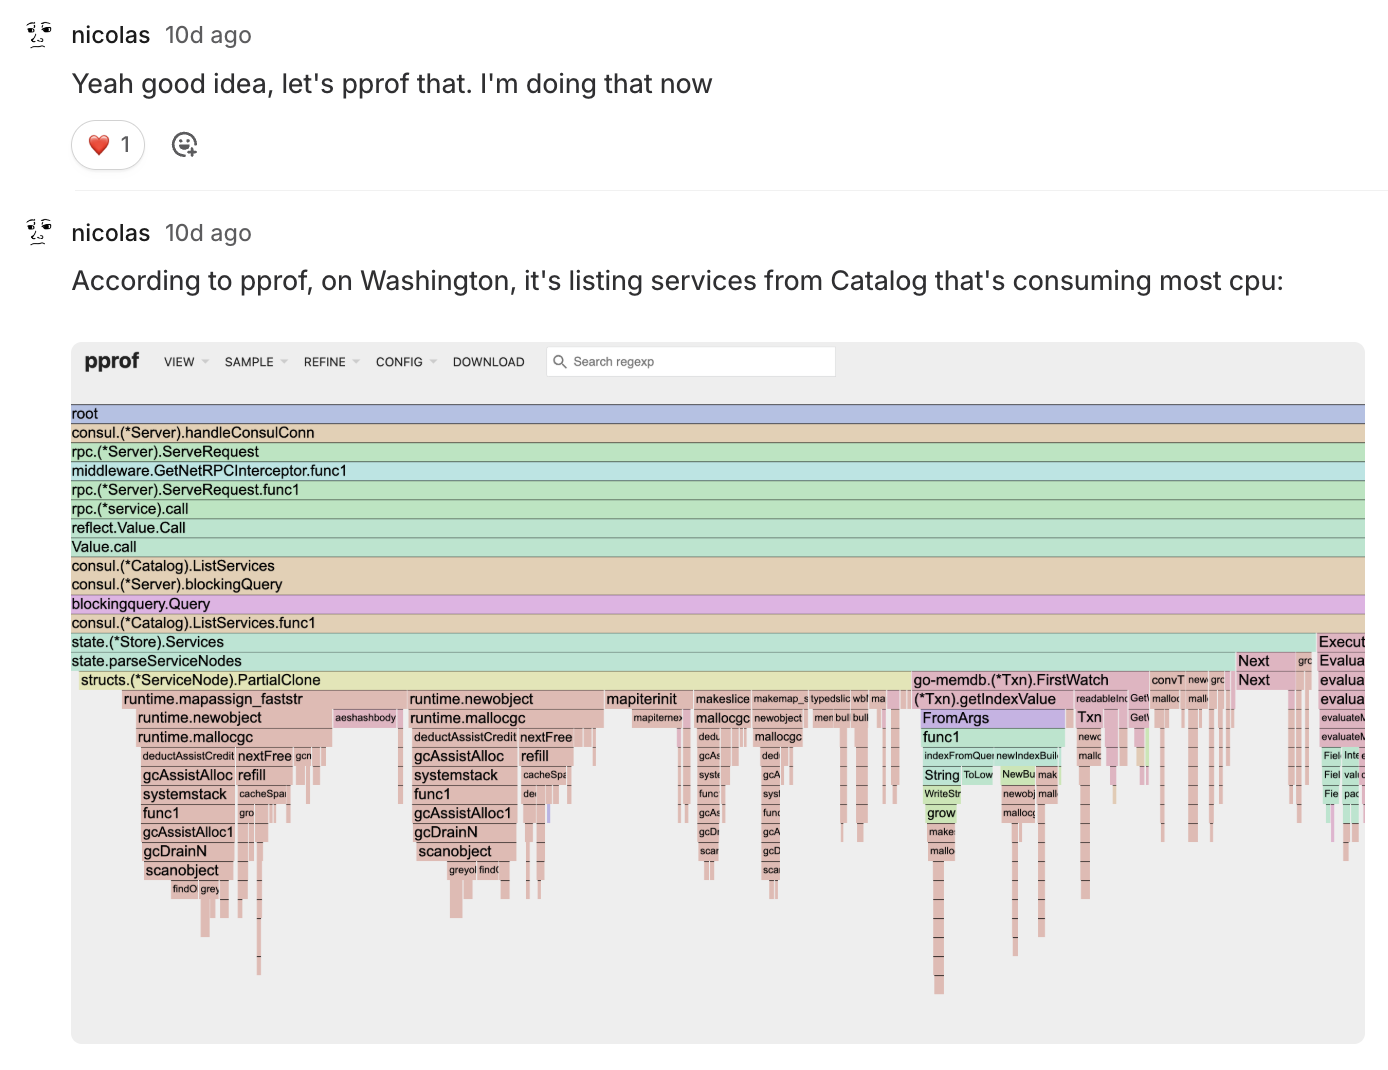
We investigated the latest code changes that could explain the issue. Nothing stood out, so we pulled out the big guns and used Consul’s pprof endpoint to get a better idea of what was going on.
We immediately spotted something weird: a huge amount of time was being spent in a specific endpoint, Catalog.ListServices(), which was eating up all the CPU.
What was odd was that we hadn’t seen any major increase in calls to this endpoint in Consul metrics. In retrospect, I think that’s because HTTP calls weren’t involved—these were RPCs from Consul Agents to Consul Servers.
We eventually enabled TRACE logs on Consul and discovered that Catalog.ListServices() was indeed being called way more than we expected.
With the root cause identified, the next step was to find out which component in our stack was responsible for calling this endpoint so frequently on our Consul cluster.

Consul Cache: The Definite Culprit
Consul is typically deployed in the following fashion:
- A few Consul Server instances: These act as the source of truth and communicate with each other to keep a consensus on the data stored
- A handful on Consul Agent instances: These maintain a local view of the machine they run on and report it to Consul Servers. It's possible to proxy calls to Consul Servers via Consul Agents
In our case, the problematic endpoint was called very rarely by our control plane. However, it was possible that Consul Agents were the ones aggressively calling this endpoint via the proxy pattern.
So we looked in that direction and started investigating components in our stack using this pattern—especially our CoreDNS plugin, which handles internal DNS resolution in our service mesh and communicates with Consul Agents to retrieve metadata.
At first glance, everything looked fine; this plugin was calling the endpoint at most once every 5 seconds.
We kept investigating our CoreDNS plugin and noticed a change we had completely missed during the initial investigation that had been deployed right before the issue started:
	servicesCatalog, _, err := p.consulClient.Catalog().Services(&consul_api.QueryOptions{
		Filter:   filter,
+		UseCache: true,
	})
The timing matched perfectly. This looked like a real lead. 👁️👁️
We enabled the UseCache option to make our system more resilient in case of Consul server downtime. This option allows us to keep a local copy of the query result, avoiding mesh DNS resolution failures in the event of communication issues with the Consul server.
However, it clearly did not work as we expected. A cache is supposed to store results locally so that the server is less solicited! Why would this change create more load on the servers?
Digging into Consul Background Refresh Caching
We then dug into Consul’s caching implementation and realized that the Catalog.ListServices() endpoint uses Background Refresh Caching, as described in the Consul docs:
Endpoints supporting background refresh caching may return a result directly from the local agent's cache without a round trip to the severs. The first fetch that is a miss will cause an initial fetch from the servers, but will also trigger the agent to begin a background blocking query that watches for any changes to that result and updates the cached value if changes occur.
Following requests will always be a cache hit until there has been no request for the resource for the TTL (which is typically 3 days).
It wasn’t entirely clear to us, so we dug into the actual implementation.
It turns out that when a query is made to a Consul Agent with the ?cached parameter, the agent registers it in memory.
From then on, it tries to keep the response fresh by re-invoking the request in the background and serving the latest result from memory when queried.
type RegisterOptionsBlockingRefresh struct{}

func (r RegisterOptionsBlockingRefresh) RegisterOptions() cache.RegisterOptions {
	return cache.RegisterOptions{
		// Maintain a blocking query, retry dropped connections quickly
		Refresh:          true,
		SupportsBlocking: true,
		RefreshTimer:     0 * time.Second,
		QueryTimeout:     10 * time.Minute,
	}
}
Here is the cache catch:
- The list of apps in Consul change often, likely invalidating the cache
- The cache key includes the filter query parameter we use, creating many background routines in the Consul Agent
This combination caused the Consul Agent to hammer Consul servers with Catalog.ListServices() queries, increasing the CPU load.
A simple fix: use a built-in cache
As is often the case, finding the root cause is much more complex than fixing it.
To resolve this issue, we simply stopped using the built-in cache parameter in our queries and implemented a minimal cache system that keeps Catalog.ListServices() results in case Consul becomes unreachable.
Exactly what we wanted in the first place.
Wrapping up
Caching isn’t always a free win, especially when it hides behind the scenes and introduces background behavior like what we saw with Consul.
We walked away with a deeper understanding of Consul internals and some lessons on troubleshooting:
- Do not hesitate to "pull out the big guns" like profilers earlier. It can actually yield results very quickly and it can be faster than expected to set up
- Diving into the source code of the tools we use can be intimidating but might be the best way to understand what is going on
- A small patch tailored for your needs in your codebase (e.g. our in-process cache) is sometimes better than relying on other tools, better tailored for other use cases
If this kind of work looks fun to you, we're hiring!